Impute data using limit of detection (LOD)
2024-04-22
Source:vignettes/TestingMissingInference.Rmd
TestingMissingInference.RmdThis vignette contains experimental code.
Example using prolfqua::MissingHelpers class
dd <- prolfqua::sim_lfq_data_protein_config(Nprot = 100,weight_missing = 2)## creating sampleName from file_name column## completing cases## completing cases done## setup done## [1] 552
contr_spec <- c("dilution.b-a" = "group_A - group_B", "dilution.c-e" = "group_A - group_Ctrl")
mh1 <- prolfqua::MissingHelpers$new(dd$data, dd$config, prob = 0.5,weighted = TRUE)
imputed <- mh1$get_contrasts(Contrasts = contr_spec)
## dilution.b-a=group_A - group_B## dilution.c-e=group_A - group_Ctrl## dilution.b-a=group_A - group_B## dilution.c-e=group_A - group_Ctrl## dilution.b-a=group_A - group_B## dilution.c-e=group_A - group_Ctrl
mh2 <- prolfqua::MissingHelpers$new(dd$data, dd$config, prob = 0.5,weighted = FALSE)
imputed2 <- mh2$get_contrasts(Contrasts = contr_spec)
## dilution.b-a=group_A - group_B
##
## dilution.c-e=group_A - group_Ctrl## dilution.b-a=group_A - group_B## dilution.c-e=group_A - group_Ctrl## dilution.b-a=group_A - group_B## dilution.c-e=group_A - group_Ctrl
mh1$get_lod()## 50%
## 18.13636
plot( imputed$estimate, -log10(imputed$p.value), pch = "*" )
points(imputed2$estimate, -log10(imputed2$p.value), col = 2, pch = "x")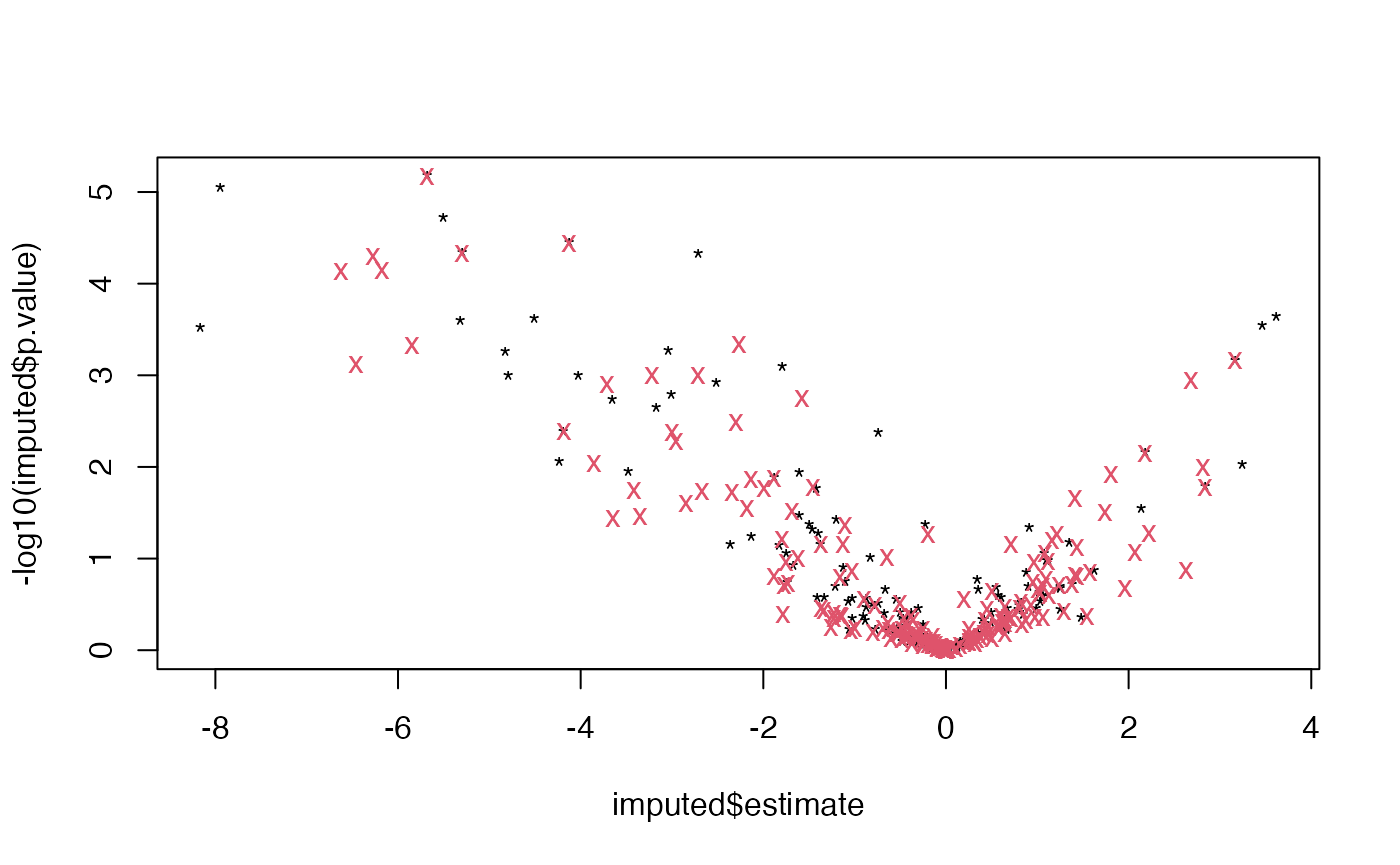
Modelling with linear models
Model with missing data
modelName <- "f_condtion_r_peptide"
formula_Protein <-
  prolfqua::strategy_lm("abundance  ~ group_",
              model_name = modelName)


dd_lfq <- prolfqua::LFQData$new(dd$data, dd$config)
mod <- prolfqua::build_model(
  dd_lfq,
  formula_Protein,
  model_name = modelName)
## Warning: There were 11 warnings in `dplyr::mutate()`.
## The first warning was:
## ℹ In argument: `linear_model = purrr::map(data, model_strategy$model_fun, pb =
## pb)`.
## ℹ In group 18: `protein_Id = "DoWup2~8058"`.
## Caused by warning:
## ! contrasts can be applied only to factors with 2 or more levels
## ℹ Run `dplyr::last_dplyr_warnings()` to see the 10 remaining warnings.
mod$model_df## # A tibble: 100 × 9
## # Groups: protein_Id [100]
## protein_Id data linear_model has_model_fit isSingular df.residual sigma
## <chr> <list> <list> <lgl> <lgl> <dbl> <dbl>
## 1 0EfVhX~3967 <tibble> <lm> TRUE FALSE 6 1.22
## 2 0m5WN4~6025 <tibble> <lm> TRUE FALSE 4 0.447
## 3 0YSKpy~2865 <tibble> <lm> TRUE TRUE 1 1.55
## 4 3QLHfm~8938 <tibble> <lm> TRUE FALSE 7 0.923
## 5 3QYop0~7543 <tibble> <lm> TRUE FALSE 7 0.808
## 6 76k03k~7094 <tibble> <lm> TRUE FALSE 8 1.09
## 7 7cbcrd~7351 <tibble> <lm> TRUE FALSE 9 0.889
## 8 7QuTub~1867 <tibble> <lm> TRUE FALSE 6 0.644
## 9 7soopj~5352 <tibble> <lm> TRUE FALSE 3 0.920
## 10 7zeekV~7127 <tibble> <lm> TRUE FALSE 6 1.06
## # ℹ 90 more rows
## # ℹ 2 more variables: nr_coef <int>, nr_coef_not_NA <int>
mod$model_df$nr_coef_not_NA |> table()##
## 2 3
## 15 74
mod$model_df$isSingular |> table()##
## FALSE TRUE
## 69 20
mod$model_df |> nrow()## [1] 100
mod$get_anova()## # A tibble: 69 × 10
## protein_Id factor Df Sum.Sq Mean.Sq F.value p.value isSingular nr_coef
## <chr> <chr> <int> <dbl> <dbl> <dbl> <dbl> <lgl> <int>
## 1 0EfVhX~3967 group_ 2 16.1 8.04 5.39 0.0457 FALSE 3
## 2 0m5WN4~6025 group_ 2 37.9 18.9 94.9 0.000426 FALSE 3
## 3 3QLHfm~8938 group_ 2 3.90 1.95 2.29 0.172 FALSE 3
## 4 3QYop0~7543 group_ 2 4.44 2.22 3.40 0.0932 FALSE 3
## 5 76k03k~7094 group_ 2 2.11 1.05 0.891 0.448 FALSE 3
## 6 7cbcrd~7351 group_ 2 21.0 10.5 13.3 0.00205 FALSE 3
## 7 7QuTub~1867 group_ 2 14.1 7.04 17.0 0.00338 FALSE 3
## 8 7zeekV~7127 group_ 2 0.425 0.212 0.189 0.832 FALSE 3
## 9 9VUkAq~9664 group_ 2 7.50 3.75 11.8 0.0128 FALSE 3
## 10 At886V~1021 group_ 2 46.3 23.2 49.4 0.00151 FALSE 3
## # ℹ 59 more rows
## # ℹ 1 more variable: FDR <dbl>
prolfqua::model_summary(mod)## $exists
##
## FALSE TRUE
## 11 89
##
## $isSingular
##
## FALSE  TRUE
##    69    20
maxcoef <- max(mod$model_df$nr_coef_not_NA, na.rm = TRUE)
goodmods <- mod$model_df |> dplyr::filter(isSingular == FALSE, has_model_fit == TRUE, nr_coef_not_NA == maxcoef)

dim(goodmods)
## [1] 61 9## nr
## 3
## 61## nr
## 3
## 61## (Intercept) group_B group_Ctrl
## (Intercept) 0.4317112 -0.4317112 -0.4317112
## group_B -0.4317112 0.7569259 0.4317112
## group_Ctrl -0.4317112 0.4317112 0.8485382Model with lod imputation
loddata <- dd$data
loddata <- loddata |> dplyr::mutate(abundance = ifelse(is.na(abundance), mh1$get_lod(), abundance))
modI <- prolfqua::build_model(
loddata,
formula_Protein,
model_name = modelName,
subject_id = dd_lfq$relevant_hierarchy_keys())
modI$model_df$nr_coef_not_NA |> table()##
## 3
## 100
modI$model_df$isSingular |> table()##
## FALSE
## 100
modI$model_df |> nrow()## [1] 100
allModels <- modI$model_df$linear_model
xx <- lapply(allModels, vcov)
sum_matrix <- Reduce(`+`, xx)
sum_matrix/length(xx)
## (Intercept) group_B group_Ctrl
## (Intercept) 0.4759103 -0.4759103 -0.4759103
## group_B -0.4759103 0.9518206 0.4759103
## group_Ctrl -0.4759103 0.4759103 0.9518206
m <- (modI$model_df$linear_model[[1]])
df.residual(m)
## [1] 9
sigma(m)## [1] 1.222678
vcov(m)## (Intercept) group_B group_Ctrl
## (Intercept) 0.3737352 -0.3737352 -0.3737352
## group_B -0.3737352 0.7474704 0.3737352
## group_Ctrl -0.3737352 0.3737352 0.7474704Session Info
## R version 4.5.2 (2025-10-31)
## Platform: x86_64-pc-linux-gnu
## Running under: Ubuntu 24.04.4 LTS
##
## Matrix products: default
## BLAS:   /usr/lib/x86_64-linux-gnu/openblas-pthread/libblas.so.3
## LAPACK: /usr/lib/x86_64-linux-gnu/openblas-pthread/libopenblasp-r0.3.26.so;  LAPACK version 3.12.0
##
## locale:
##  [1] LC_CTYPE=C.UTF-8       LC_NUMERIC=C           LC_TIME=C.UTF-8
##  [4] LC_COLLATE=C.UTF-8     LC_MONETARY=C.UTF-8    LC_MESSAGES=C.UTF-8
##  [7] LC_PAPER=C.UTF-8       LC_NAME=C              LC_ADDRESS=C
## [10] LC_TELEPHONE=C         LC_MEASUREMENT=C.UTF-8 LC_IDENTIFICATION=C
##
## time zone: UTC
## tzcode source: system (glibc)
##
## attached base packages:
## [1] stats     graphics  grDevices utils     datasets  methods   base
##
## loaded via a namespace (and not attached):
##   [1] Rdpack_2.6.6           gridExtra_2.3.1        rlang_1.3.0
##   [4] magrittr_2.0.5         clue_0.3-68            GetoptLong_1.1.1
##   [7] otel_0.2.0             matrixStats_1.5.0      compiler_4.5.2
##  [10] mgcv_1.9-3             png_0.1-9              systemfonts_1.3.2
##  [13] vctrs_0.7.3            pkgconfig_2.0.3        shape_1.4.6.1
##  [16] crayon_1.5.3           fastmap_1.2.0          backports_1.5.1
##  [19] utf8_1.2.6             rmarkdown_2.31         nloptr_2.2.1
##  [22] ragg_1.5.2             UpSetR_1.4.1           purrr_1.2.2
##  [25] xfun_0.60              glmnet_5.0             jomo_2.7-6
##  [28] logistf_1.26.1         cachem_1.1.0           jsonlite_2.0.0
##  [31] progress_1.2.3         pan_2.0                broom_1.0.13
##  [34] parallel_4.5.2         prettyunits_1.2.0      cluster_2.1.8.1
##  [37] R6_2.6.1               bslib_0.11.0           stringi_1.8.7
##  [40] RColorBrewer_1.1-3     limma_3.66.0           boot_1.3-32
##  [43] rpart_4.1.24           jquerylib_0.1.4        Rcpp_1.1.2
##  [46] iterators_1.0.14       knitr_1.51             IRanges_2.44.0
##  [49] Matrix_1.7-4           splines_4.5.2          nnet_7.3-20
##  [52] tidyselect_1.2.1       yaml_2.3.12            doParallel_1.0.17
##  [55] codetools_0.2-20       lattice_0.22-7         tibble_3.3.1
##  [58] plyr_1.8.9             withr_3.0.3            S7_0.2.2
##  [61] prolfqua_1.7.0         evaluate_1.0.5         desc_1.4.3
##  [64] survival_3.8-3         circlize_0.4.18        pillar_1.11.1
##  [67] mice_3.19.0            foreach_1.5.2          stats4_4.5.2
##  [70] reformulas_0.4.4       plotly_4.12.1          generics_0.1.4
##  [73] S4Vectors_0.48.1       hms_1.1.4              ggplot2_4.0.3
##  [76] scales_1.4.0           minqa_1.2.8            glue_1.8.1
##  [79] tools_4.5.2            data.table_1.18.4      lme4_2.0-6
##  [82] forcats_1.0.1          fs_2.1.0               grid_4.5.2
##  [85] tidyr_1.3.2            rbibutils_2.4.1        colorspace_2.1-3
##  [88] nlme_3.1-168           formula.tools_1.7.1    cli_3.6.6
##  [91] textshaping_1.0.5      viridisLite_0.4.3      ComplexHeatmap_2.26.1
##  [94] dplyr_1.2.1            gtable_0.3.6           sass_0.4.10
##  [97] digest_0.6.39          operator.tools_1.6.3.1 BiocGenerics_0.56.0
## [100] ggrepel_0.9.8          rjson_0.2.23           htmlwidgets_1.6.4
## [103] farver_2.1.2           htmltools_0.5.9        pkgdown_2.2.1
## [106] lifecycle_1.0.5        httr_1.4.8             GlobalOptions_0.1.4
## [109] mitml_0.4-5            statmod_1.5.2          MASS_7.3-65