normal pairs plot with different pch and plus abline
Examples
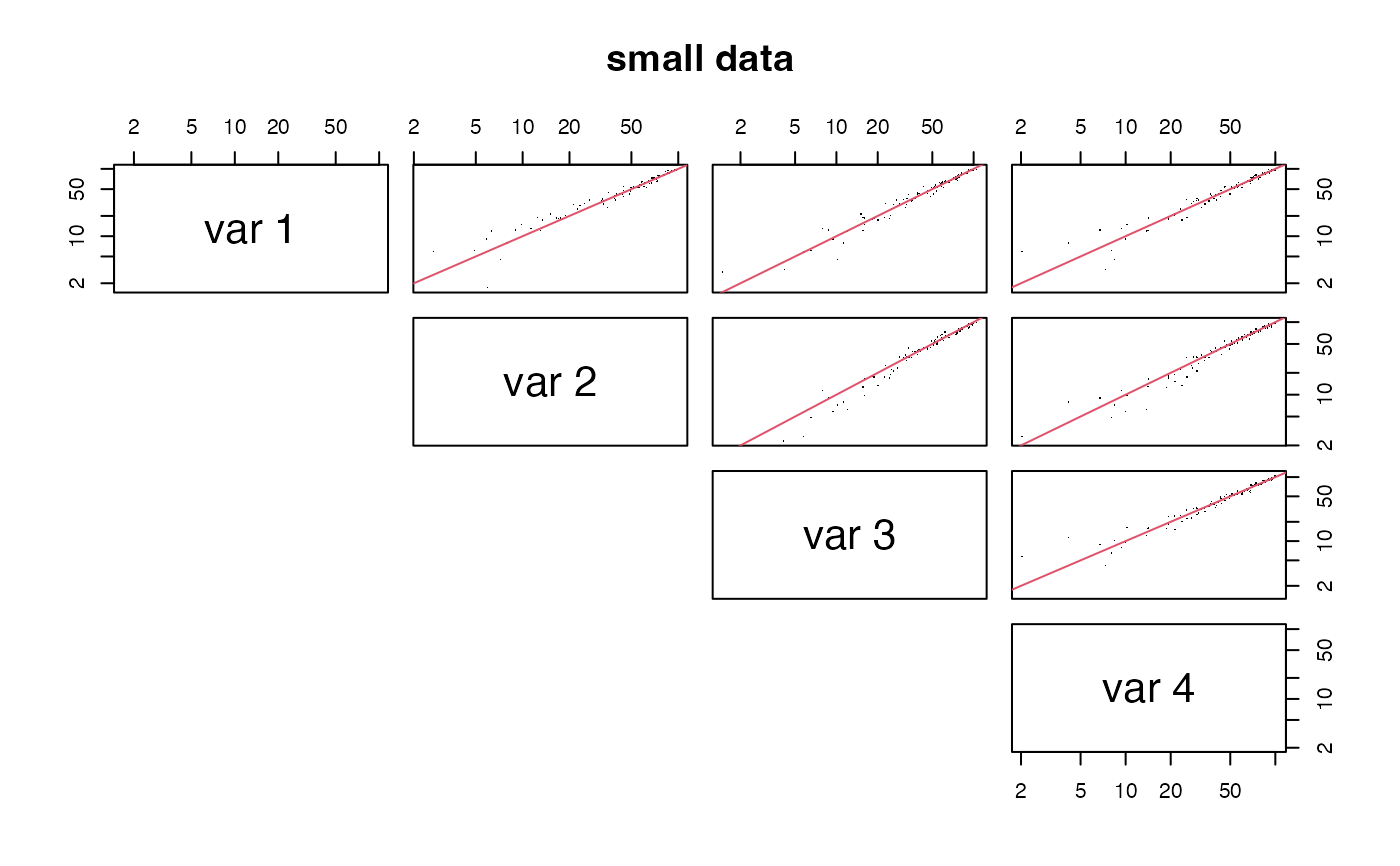
tmp = matrix(rep((1:100),times = 4) + rnorm(100*4,0,3),ncol=4)
pairs_w_abline(tmp,log="xy",main="small data")
#> Warning: 1 x value <= 0 omitted from logarithmic plot
#> Warning: 1 y value <= 0 omitted from logarithmic plot
#> Warning: 1 x value <= 0 omitted from logarithmic plot
#> Warning: 2 y values <= 0 omitted from logarithmic plot
#> Warning: 1 x value <= 0 omitted from logarithmic plot
#> Warning: 1 y value <= 0 omitted from logarithmic plot
#> Warning: 1 x value <= 0 omitted from logarithmic plot
#> Warning: 3 y values <= 0 omitted from logarithmic plot
#> Warning: 2 x values <= 0 omitted from logarithmic plot
#> Warning: 1 y value <= 0 omitted from logarithmic plot
#> Warning: 2 x values <= 0 omitted from logarithmic plot
#> Warning: 2 y values <= 0 omitted from logarithmic plot
#> Warning: 2 x values <= 0 omitted from logarithmic plot
#> Warning: 1 y value <= 0 omitted from logarithmic plot
#> Warning: 2 x values <= 0 omitted from logarithmic plot
#> Warning: 3 y values <= 0 omitted from logarithmic plot
#> Warning: 1 x value <= 0 omitted from logarithmic plot
#> Warning: 1 y value <= 0 omitted from logarithmic plot
#> Warning: 1 x value <= 0 omitted from logarithmic plot
#> Warning: 2 y values <= 0 omitted from logarithmic plot
#> Warning: 1 x value <= 0 omitted from logarithmic plot
#> Warning: 1 y value <= 0 omitted from logarithmic plot
#> Warning: 1 x value <= 0 omitted from logarithmic plot
#> Warning: 3 y values <= 0 omitted from logarithmic plot
#> Warning: 3 x values <= 0 omitted from logarithmic plot
#> Warning: 1 y value <= 0 omitted from logarithmic plot
#> Warning: 3 x values <= 0 omitted from logarithmic plot
#> Warning: 2 y values <= 0 omitted from logarithmic plot
#> Warning: 3 x values <= 0 omitted from logarithmic plot
#> Warning: 1 y value <= 0 omitted from logarithmic plot
#> Warning: 3 x values <= 0 omitted from logarithmic plot
#> Warning: 3 y values <= 0 omitted from logarithmic plot
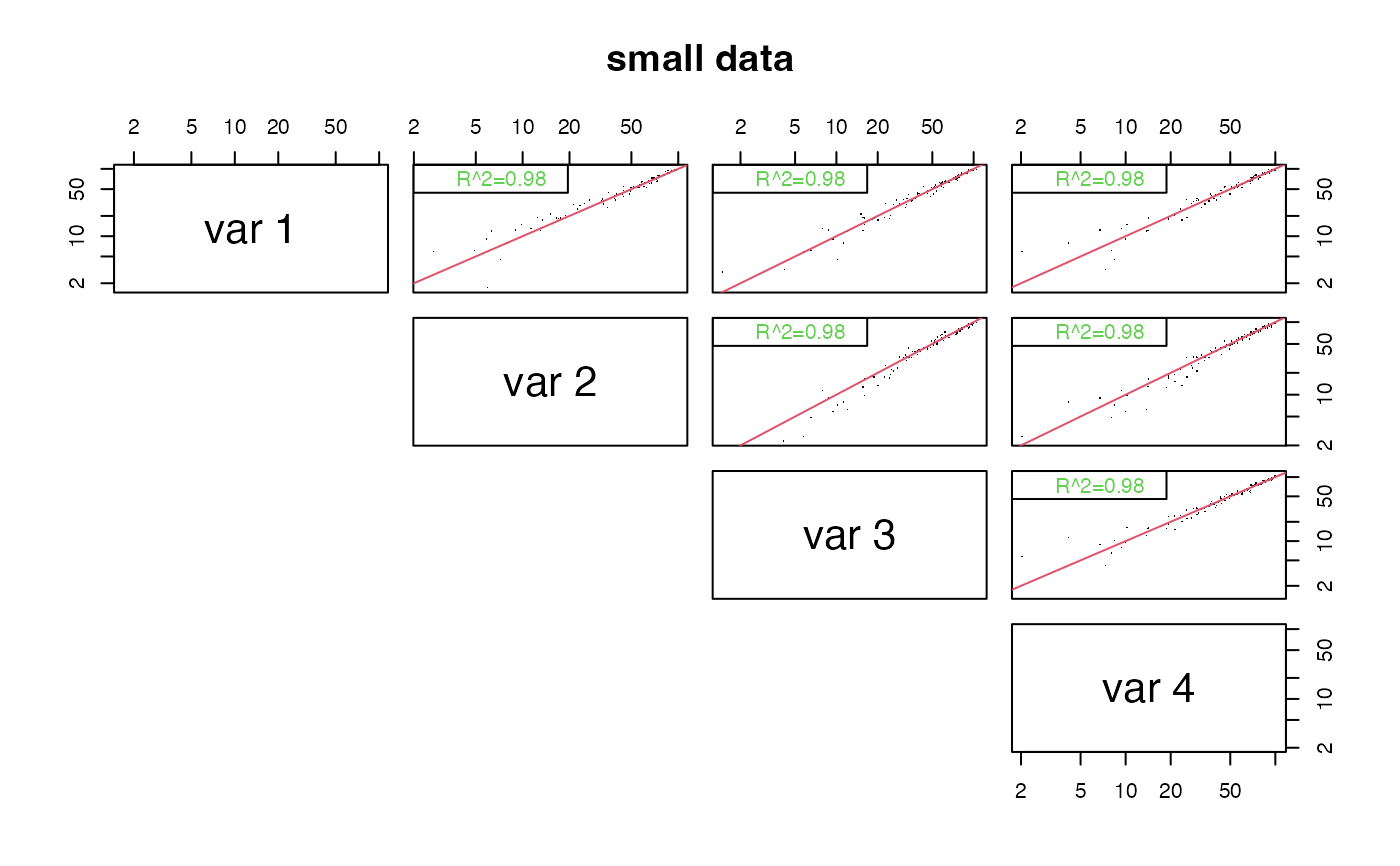
 pairs_w_abline(tmp,log="xy",main="small data", legend=TRUE)
#> Warning: 1 x value <= 0 omitted from logarithmic plot
#> Warning: 1 y value <= 0 omitted from logarithmic plot
#> Warning: 1 x value <= 0 omitted from logarithmic plot
#> Warning: 2 y values <= 0 omitted from logarithmic plot
#> Warning: 1 x value <= 0 omitted from logarithmic plot
#> Warning: 1 y value <= 0 omitted from logarithmic plot
#> Warning: 1 x value <= 0 omitted from logarithmic plot
#> Warning: 3 y values <= 0 omitted from logarithmic plot
#> Warning: 2 x values <= 0 omitted from logarithmic plot
#> Warning: 1 y value <= 0 omitted from logarithmic plot
#> Warning: 2 x values <= 0 omitted from logarithmic plot
#> Warning: 2 y values <= 0 omitted from logarithmic plot
#> Warning: 2 x values <= 0 omitted from logarithmic plot
#> Warning: 1 y value <= 0 omitted from logarithmic plot
#> Warning: 2 x values <= 0 omitted from logarithmic plot
#> Warning: 3 y values <= 0 omitted from logarithmic plot
#> Warning: 1 x value <= 0 omitted from logarithmic plot
#> Warning: 1 y value <= 0 omitted from logarithmic plot
#> Warning: 1 x value <= 0 omitted from logarithmic plot
#> Warning: 2 y values <= 0 omitted from logarithmic plot
#> Warning: 1 x value <= 0 omitted from logarithmic plot
#> Warning: 1 y value <= 0 omitted from logarithmic plot
#> Warning: 1 x value <= 0 omitted from logarithmic plot
#> Warning: 3 y values <= 0 omitted from logarithmic plot
#> Warning: 3 x values <= 0 omitted from logarithmic plot
#> Warning: 1 y value <= 0 omitted from logarithmic plot
#> Warning: 3 x values <= 0 omitted from logarithmic plot
#> Warning: 2 y values <= 0 omitted from logarithmic plot
#> Warning: 3 x values <= 0 omitted from logarithmic plot
#> Warning: 1 y value <= 0 omitted from logarithmic plot
#> Warning: 3 x values <= 0 omitted from logarithmic plot
#> Warning: 3 y values <= 0 omitted from logarithmic plot
pairs_w_abline(tmp,log="xy",main="small data", legend=TRUE)
#> Warning: 1 x value <= 0 omitted from logarithmic plot
#> Warning: 1 y value <= 0 omitted from logarithmic plot
#> Warning: 1 x value <= 0 omitted from logarithmic plot
#> Warning: 2 y values <= 0 omitted from logarithmic plot
#> Warning: 1 x value <= 0 omitted from logarithmic plot
#> Warning: 1 y value <= 0 omitted from logarithmic plot
#> Warning: 1 x value <= 0 omitted from logarithmic plot
#> Warning: 3 y values <= 0 omitted from logarithmic plot
#> Warning: 2 x values <= 0 omitted from logarithmic plot
#> Warning: 1 y value <= 0 omitted from logarithmic plot
#> Warning: 2 x values <= 0 omitted from logarithmic plot
#> Warning: 2 y values <= 0 omitted from logarithmic plot
#> Warning: 2 x values <= 0 omitted from logarithmic plot
#> Warning: 1 y value <= 0 omitted from logarithmic plot
#> Warning: 2 x values <= 0 omitted from logarithmic plot
#> Warning: 3 y values <= 0 omitted from logarithmic plot
#> Warning: 1 x value <= 0 omitted from logarithmic plot
#> Warning: 1 y value <= 0 omitted from logarithmic plot
#> Warning: 1 x value <= 0 omitted from logarithmic plot
#> Warning: 2 y values <= 0 omitted from logarithmic plot
#> Warning: 1 x value <= 0 omitted from logarithmic plot
#> Warning: 1 y value <= 0 omitted from logarithmic plot
#> Warning: 1 x value <= 0 omitted from logarithmic plot
#> Warning: 3 y values <= 0 omitted from logarithmic plot
#> Warning: 3 x values <= 0 omitted from logarithmic plot
#> Warning: 1 y value <= 0 omitted from logarithmic plot
#> Warning: 3 x values <= 0 omitted from logarithmic plot
#> Warning: 2 y values <= 0 omitted from logarithmic plot
#> Warning: 3 x values <= 0 omitted from logarithmic plot
#> Warning: 1 y value <= 0 omitted from logarithmic plot
#> Warning: 3 x values <= 0 omitted from logarithmic plot
#> Warning: 3 y values <= 0 omitted from logarithmic plot