Decorates LFQData with methods to aggregate protein intensities aggregates intensities
Source:R/LFQDataAggregator.R
LFQDataAggregator.RdDecorates LFQData with methods to aggregate protein intensities aggregates intensities
Decorates LFQData with methods to aggregate protein intensities aggregates intensities
See also
Other LFQData:
LFQData,
LFQDataImp,
LFQDataPlotter,
LFQDataStats,
LFQDataSummariser,
LFQDataToSummarizedExperiment()
Public fields
lfqLFQData
lfq_aggaggregation result
prefixto use for aggregation results e.g. protein
Methods
Method medpolish()
aggregate using median polish
Method plot()
creates aggregation plots
Method write_plots()
writes plots to folder
Usage
LFQDataAggregator$write_plots(
  qcpath,
  subset = NULL,
  show.legend = FALSE,
  width = 6,
  height = 6
)Examples
istar <- prolfqua::sim_lfq_data_peptide_config()
#> creating sampleName from fileName column
#> completing cases
#> completing cases done
#> setup done
istar$config <- istar$config
data <- istar$data |> dplyr::filter(protein_Id %in% sample(protein_Id, 100))
lfqdata <- LFQData$new(data, istar$config)
lfqTrans <- lfqdata$clone()$get_Transformer()
lfqTrans$log2()
#> Column added : log2_abundance
lfqTrans <- lfqTrans$robscale()$lfq
#> data is : TRUE
#> Joining with `by = join_by(sampleName, isotopeLabel, protein_Id, peptide_Id)`
lfqAggregator <- LFQDataAggregator$new(lfqTrans, "protein")
lfqAggregator$medpolish()
#> starting aggregation
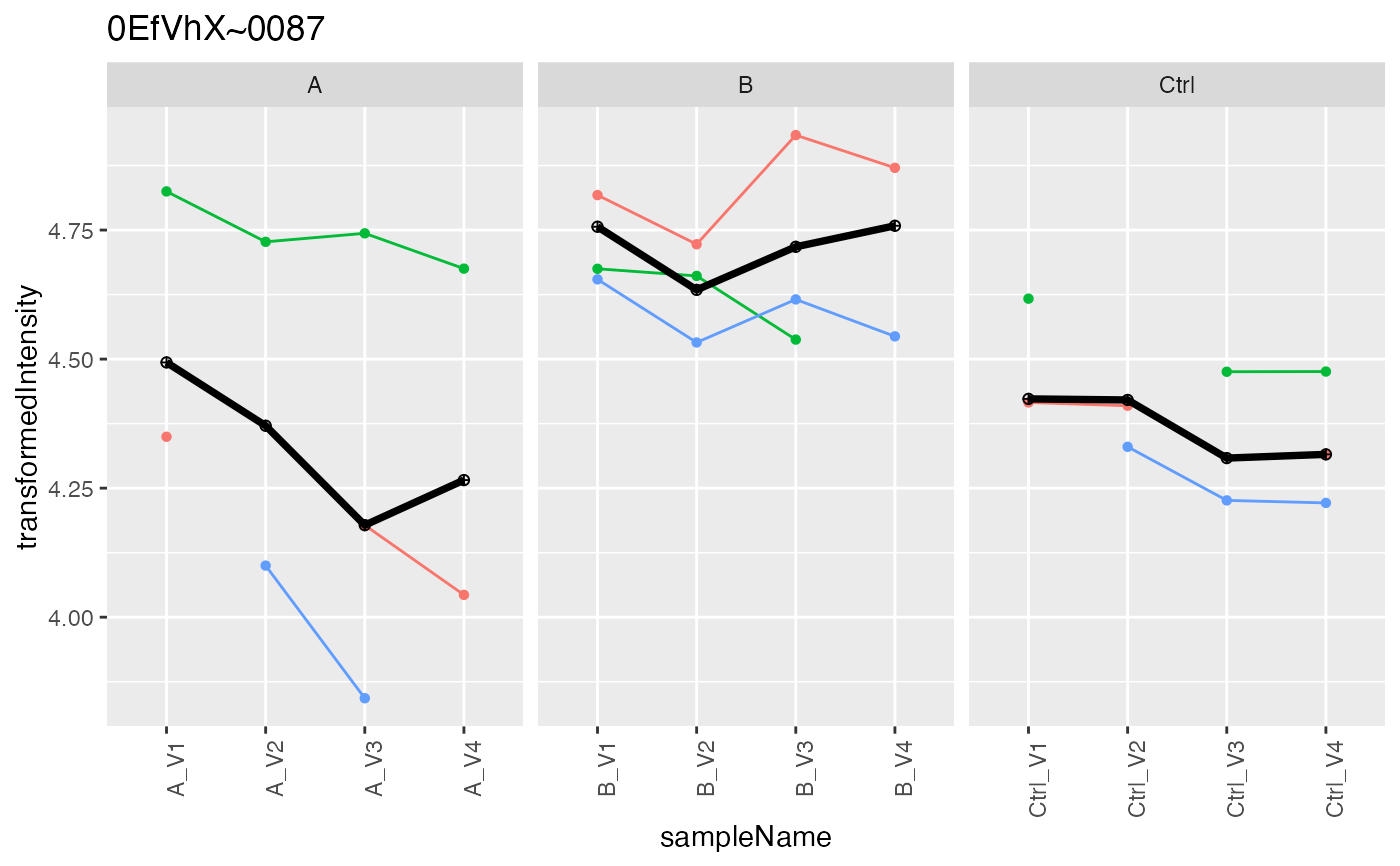
pmed <- lfqAggregator$plot()
pmed$plots[[1]]
#> Warning: Removed 7 rows containing missing values or values outside the scale range
#> (`geom_point()`).
#> Warning: Removed 4 rows containing missing values or values outside the scale range
#> (`geom_line()`).
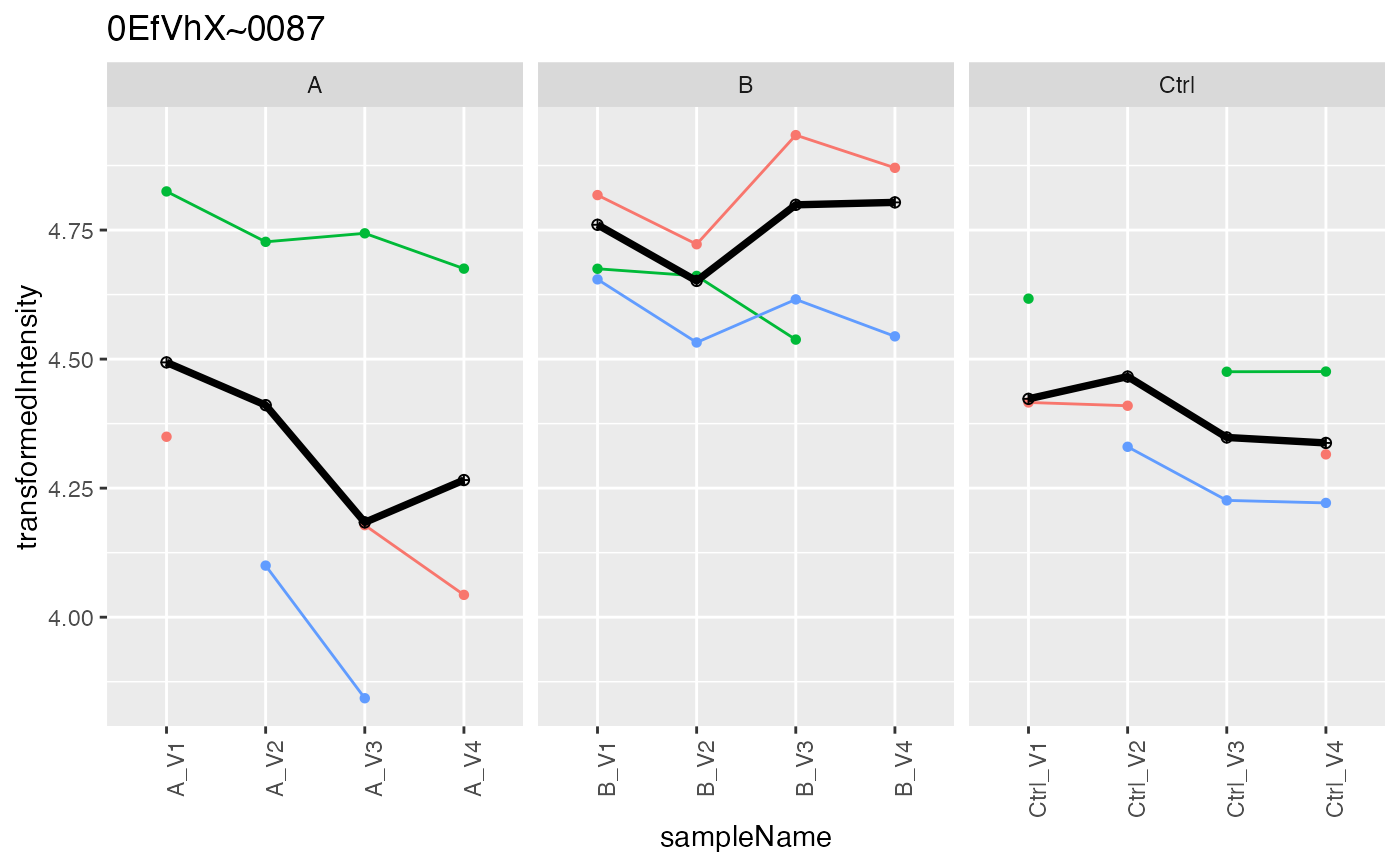
 lfqAggregator$lmrob()
#> starting aggregation
prob <- lfqAggregator$plot()
prob$plots[[1]]
#> Warning: Removed 7 rows containing missing values or values outside the scale range
#> (`geom_point()`).
#> Warning: Removed 4 rows containing missing values or values outside the scale range
#> (`geom_line()`).
lfqAggregator$lmrob()
#> starting aggregation
prob <- lfqAggregator$plot()
prob$plots[[1]]
#> Warning: Removed 7 rows containing missing values or values outside the scale range
#> (`geom_point()`).
#> Warning: Removed 4 rows containing missing values or values outside the scale range
#> (`geom_line()`).
 lfqCopy <- lfqdata$clone()
lfqCopy$is_transformed()
#> [1] FALSE
lfqAggregator <- LFQDataAggregator$new(lfqCopy, "protein")
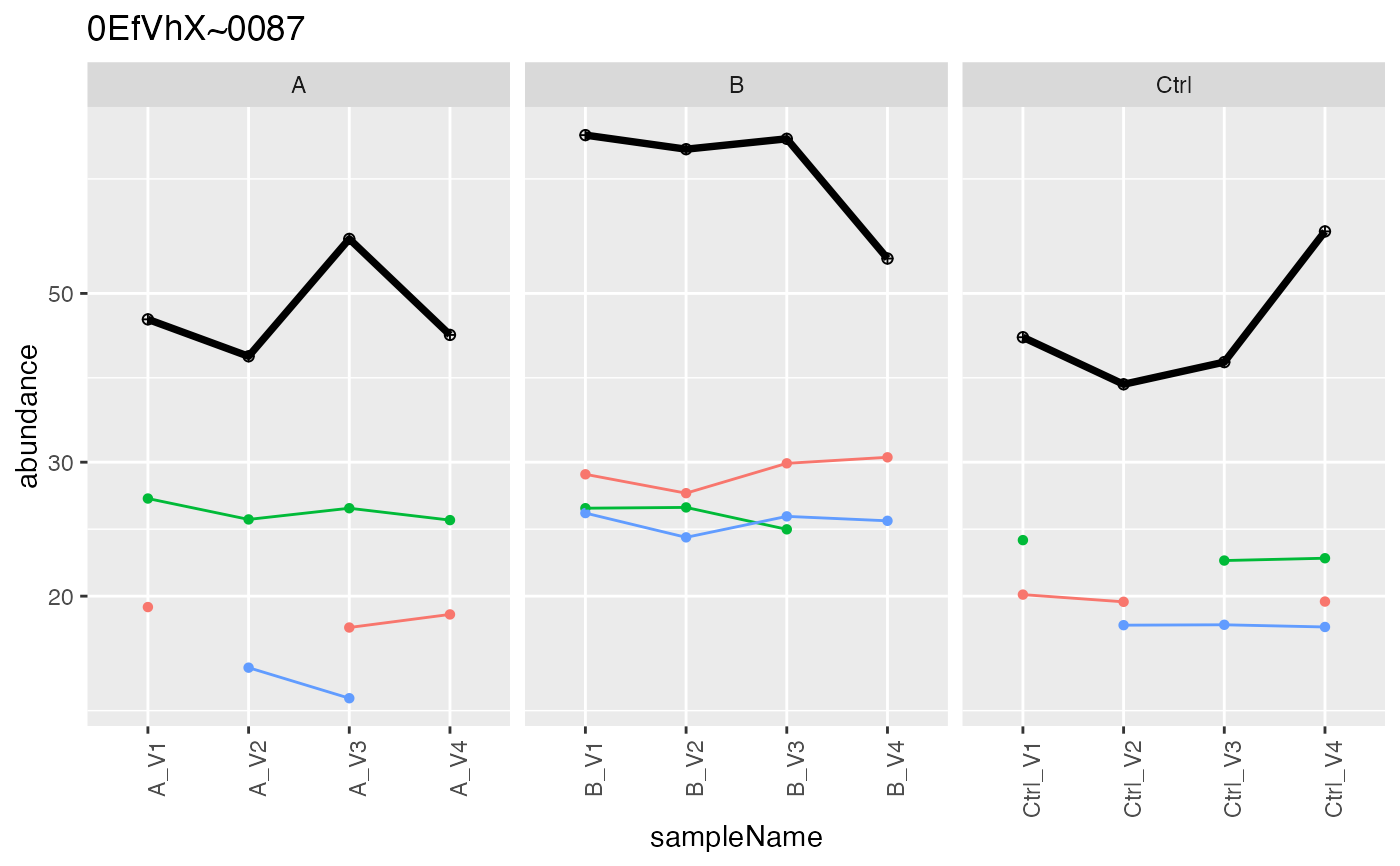
lfqAggregator$sum_topN()
#> Joining with `by = join_by(protein_Id, peptide_Id)`
#> Columns added : srm_meanInt srm_meanIntRank
pSum <- lfqAggregator$plot()
pSum$plots[[1]]
#> Warning: Removed 7 rows containing missing values or values outside the scale range
#> (`geom_point()`).
#> Warning: Removed 4 rows containing missing values or values outside the scale range
#> (`geom_line()`).
lfqCopy <- lfqdata$clone()
lfqCopy$is_transformed()
#> [1] FALSE
lfqAggregator <- LFQDataAggregator$new(lfqCopy, "protein")
lfqAggregator$sum_topN()
#> Joining with `by = join_by(protein_Id, peptide_Id)`
#> Columns added : srm_meanInt srm_meanIntRank
pSum <- lfqAggregator$plot()
pSum$plots[[1]]
#> Warning: Removed 7 rows containing missing values or values outside the scale range
#> (`geom_point()`).
#> Warning: Removed 4 rows containing missing values or values outside the scale range
#> (`geom_line()`).
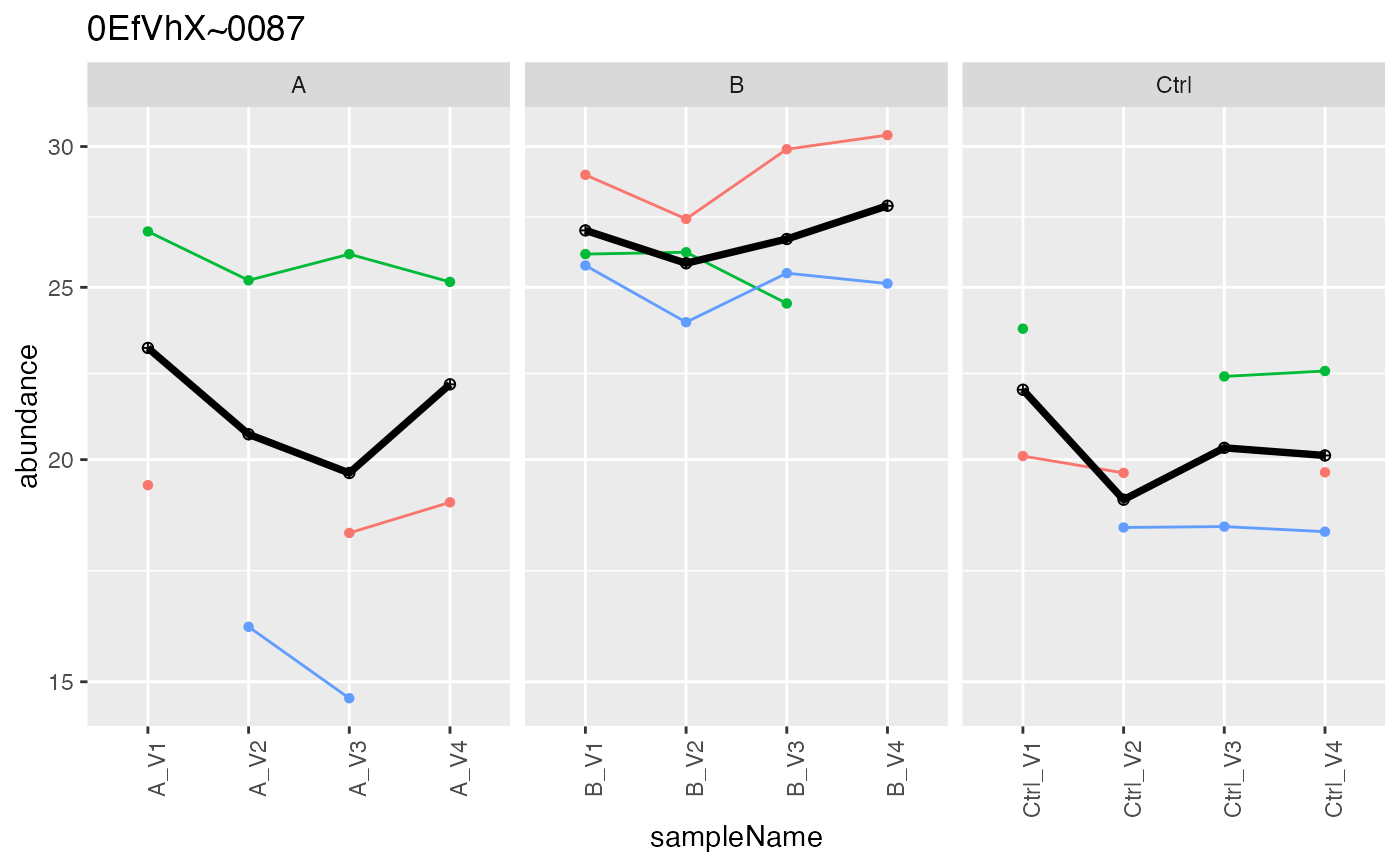
 lfqAggregator$mean_topN()
#> Joining with `by = join_by(protein_Id, peptide_Id)`
#> Columns added : srm_meanInt srm_meanIntRank
pMean <- lfqAggregator$plot()
pMean$plots[[1]]
#> Warning: Removed 7 rows containing missing values or values outside the scale range
#> (`geom_point()`).
#> Warning: Removed 4 rows containing missing values or values outside the scale range
#> (`geom_line()`).
lfqAggregator$mean_topN()
#> Joining with `by = join_by(protein_Id, peptide_Id)`
#> Columns added : srm_meanInt srm_meanIntRank
pMean <- lfqAggregator$plot()
pMean$plots[[1]]
#> Warning: Removed 7 rows containing missing values or values outside the scale range
#> (`geom_point()`).
#> Warning: Removed 4 rows containing missing values or values outside the scale range
#> (`geom_line()`).
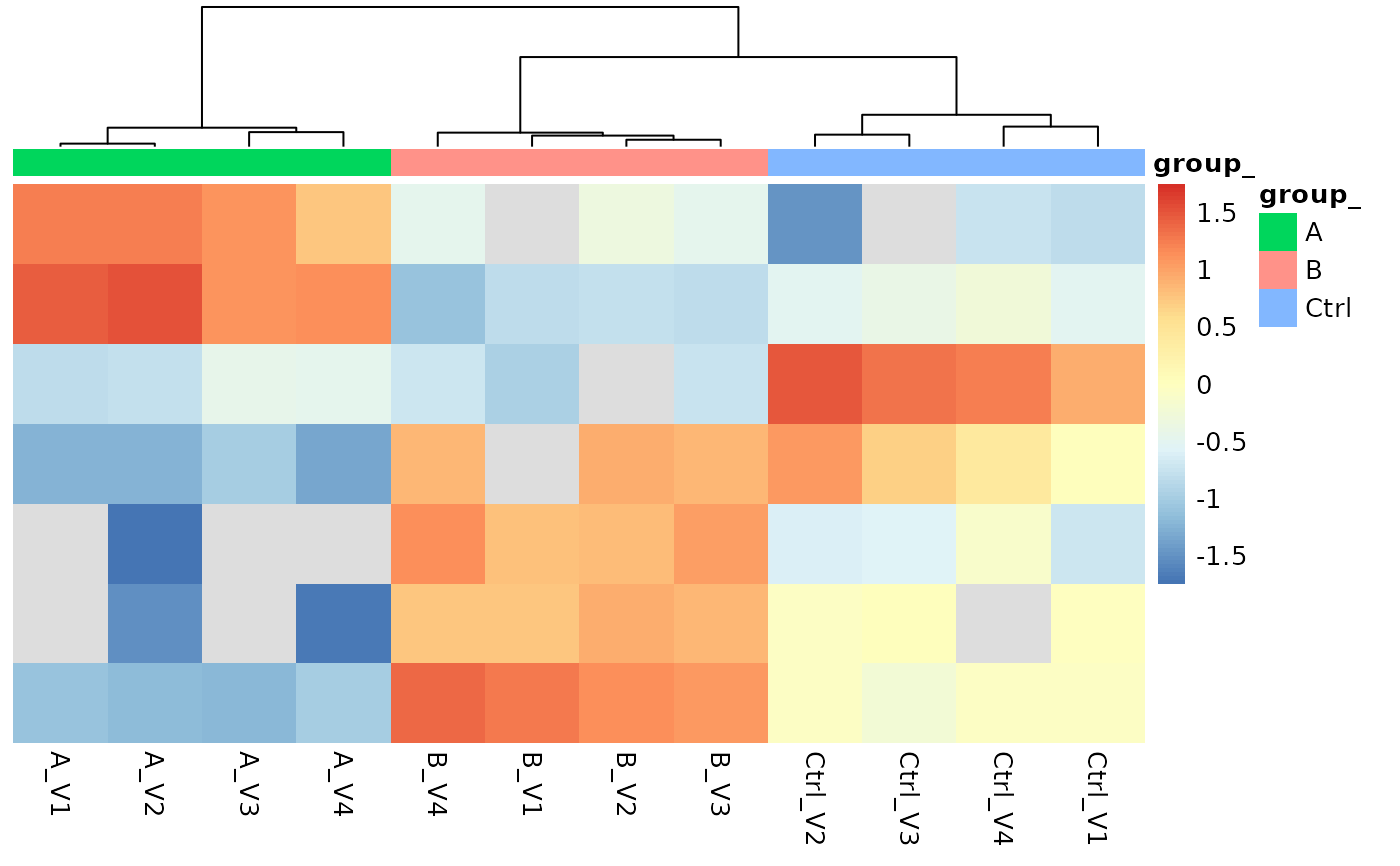
 protPlotter <- lfqAggregator$lfq_agg$get_Plotter()
protPlotter$heatmap()
protPlotter <- lfqAggregator$lfq_agg$get_Plotter()
protPlotter$heatmap()
 lfqAggregator$write_plots(tempdir())
#> Warning: Removed 7 rows containing missing values or values outside the scale range
#> (`geom_point()`).
#> Warning: Removed 4 rows containing missing values or values outside the scale range
#> (`geom_line()`).
#> `geom_line()`: Each group consists of only one observation.
#> ℹ Do you need to adjust the group aesthetic?
#> `geom_line()`: Each group consists of only one observation.
#> ℹ Do you need to adjust the group aesthetic?
#> Warning: Removed 2 rows containing missing values or values outside the scale range
#> (`geom_point()`).
#> Warning: Removed 1 row containing missing values or values outside the scale range
#> (`geom_line()`).
#> Warning: Removed 1 row containing missing values or values outside the scale range
#> (`geom_point()`).
#> Warning: Removed 5 rows containing missing values or values outside the scale range
#> (`geom_point()`).
#> Warning: Removed 3 rows containing missing values or values outside the scale range
#> (`geom_line()`).
#> `geom_line()`: Each group consists of only one observation.
#> ℹ Do you need to adjust the group aesthetic?
#> Warning: Removed 1 row containing missing values or values outside the scale range
#> (`geom_point()`).
#> Warning: Removed 1 row containing missing values or values outside the scale range
#> (`geom_line()`).
#> Warning: Removed 8 rows containing missing values or values outside the scale range
#> (`geom_point()`).
#> Warning: Removed 6 rows containing missing values or values outside the scale range
#> (`geom_line()`).
#> `geom_line()`: Each group consists of only one observation.
#> ℹ Do you need to adjust the group aesthetic?
#> Warning: Removed 3 rows containing missing values or values outside the scale range
#> (`geom_point()`).
#> Warning: Removed 2 rows containing missing values or values outside the scale range
#> (`geom_line()`).
#> Warning: Removed 9 rows containing missing values or values outside the scale range
#> (`geom_point()`).
#> Warning: Removed 7 rows containing missing values or values outside the scale range
#> (`geom_line()`).
#> `geom_line()`: Each group consists of only one observation.
#> ℹ Do you need to adjust the group aesthetic?
lfqAggregator$write_plots(tempdir())
#> Warning: Removed 7 rows containing missing values or values outside the scale range
#> (`geom_point()`).
#> Warning: Removed 4 rows containing missing values or values outside the scale range
#> (`geom_line()`).
#> `geom_line()`: Each group consists of only one observation.
#> ℹ Do you need to adjust the group aesthetic?
#> `geom_line()`: Each group consists of only one observation.
#> ℹ Do you need to adjust the group aesthetic?
#> Warning: Removed 2 rows containing missing values or values outside the scale range
#> (`geom_point()`).
#> Warning: Removed 1 row containing missing values or values outside the scale range
#> (`geom_line()`).
#> Warning: Removed 1 row containing missing values or values outside the scale range
#> (`geom_point()`).
#> Warning: Removed 5 rows containing missing values or values outside the scale range
#> (`geom_point()`).
#> Warning: Removed 3 rows containing missing values or values outside the scale range
#> (`geom_line()`).
#> `geom_line()`: Each group consists of only one observation.
#> ℹ Do you need to adjust the group aesthetic?
#> Warning: Removed 1 row containing missing values or values outside the scale range
#> (`geom_point()`).
#> Warning: Removed 1 row containing missing values or values outside the scale range
#> (`geom_line()`).
#> Warning: Removed 8 rows containing missing values or values outside the scale range
#> (`geom_point()`).
#> Warning: Removed 6 rows containing missing values or values outside the scale range
#> (`geom_line()`).
#> `geom_line()`: Each group consists of only one observation.
#> ℹ Do you need to adjust the group aesthetic?
#> Warning: Removed 3 rows containing missing values or values outside the scale range
#> (`geom_point()`).
#> Warning: Removed 2 rows containing missing values or values outside the scale range
#> (`geom_line()`).
#> Warning: Removed 9 rows containing missing values or values outside the scale range
#> (`geom_point()`).
#> Warning: Removed 7 rows containing missing values or values outside the scale range
#> (`geom_line()`).
#> `geom_line()`: Each group consists of only one observation.
#> ℹ Do you need to adjust the group aesthetic?