Summarize LFQData
Summarize LFQData
Methods
Method hierarchy_counts_sample()
number of elements at each level in every sample
Usage
LFQDataSummariser$hierarchy_counts_sample(
  value = c("wide", "long"),
  nr_children = 1
)Method plot_hierarchy_counts_sample()
barplot showing number of elements at each level in every sample
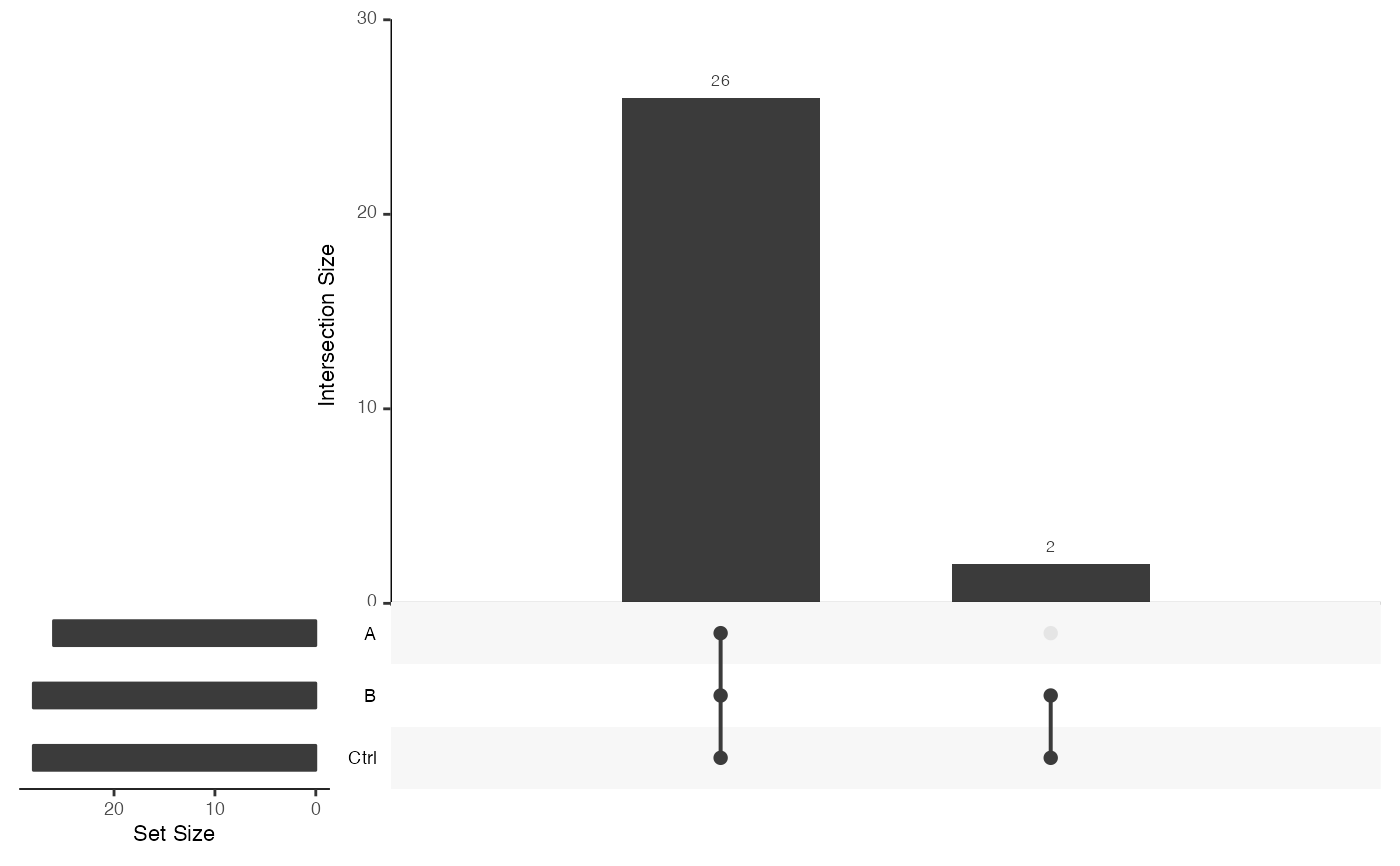
Method upset_interaction_missing_stats()
upset plot with missing information per protein and condition
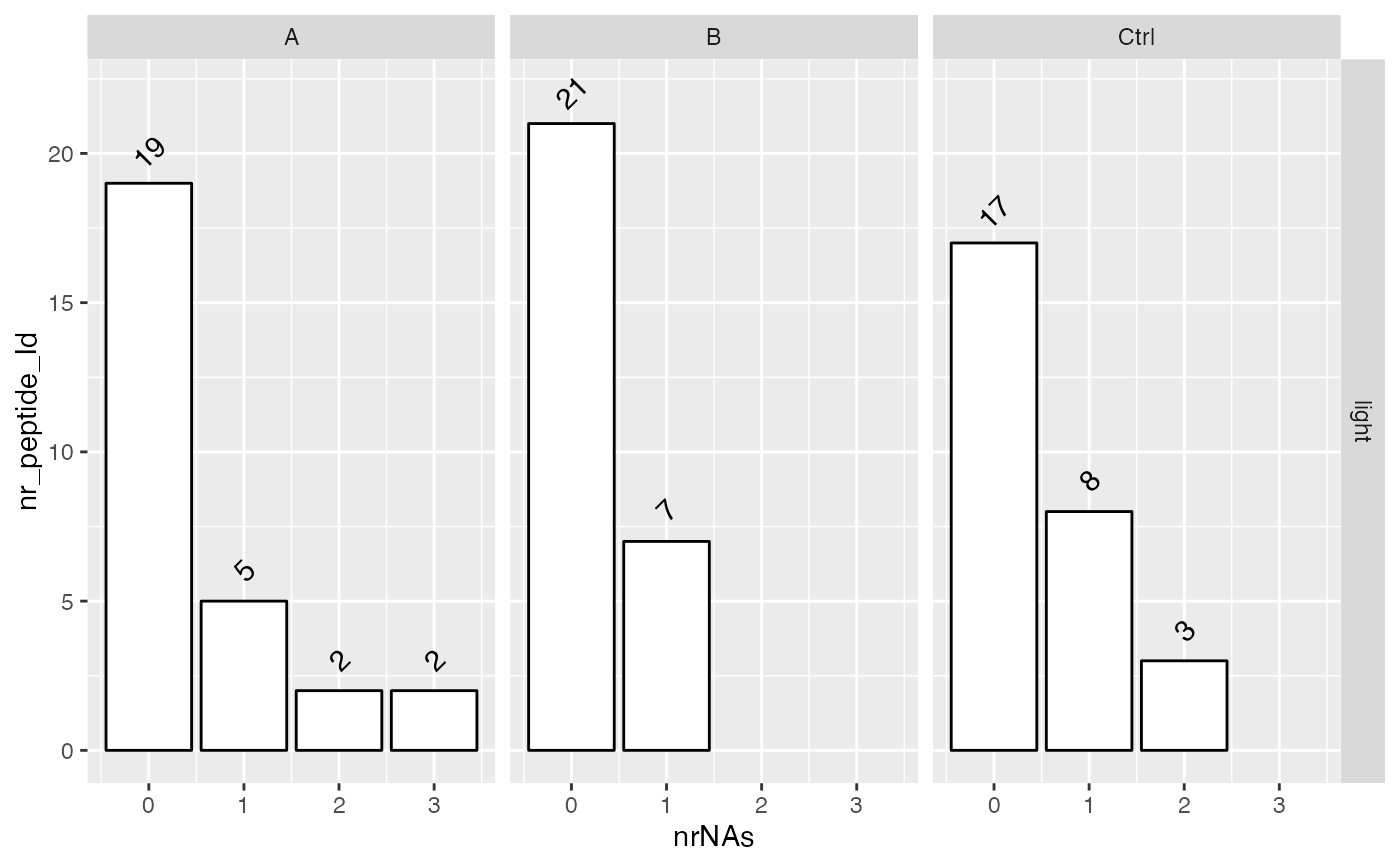
Method plot_missingness_per_group()
barplot with number of features with 1,2, etc missing in condition
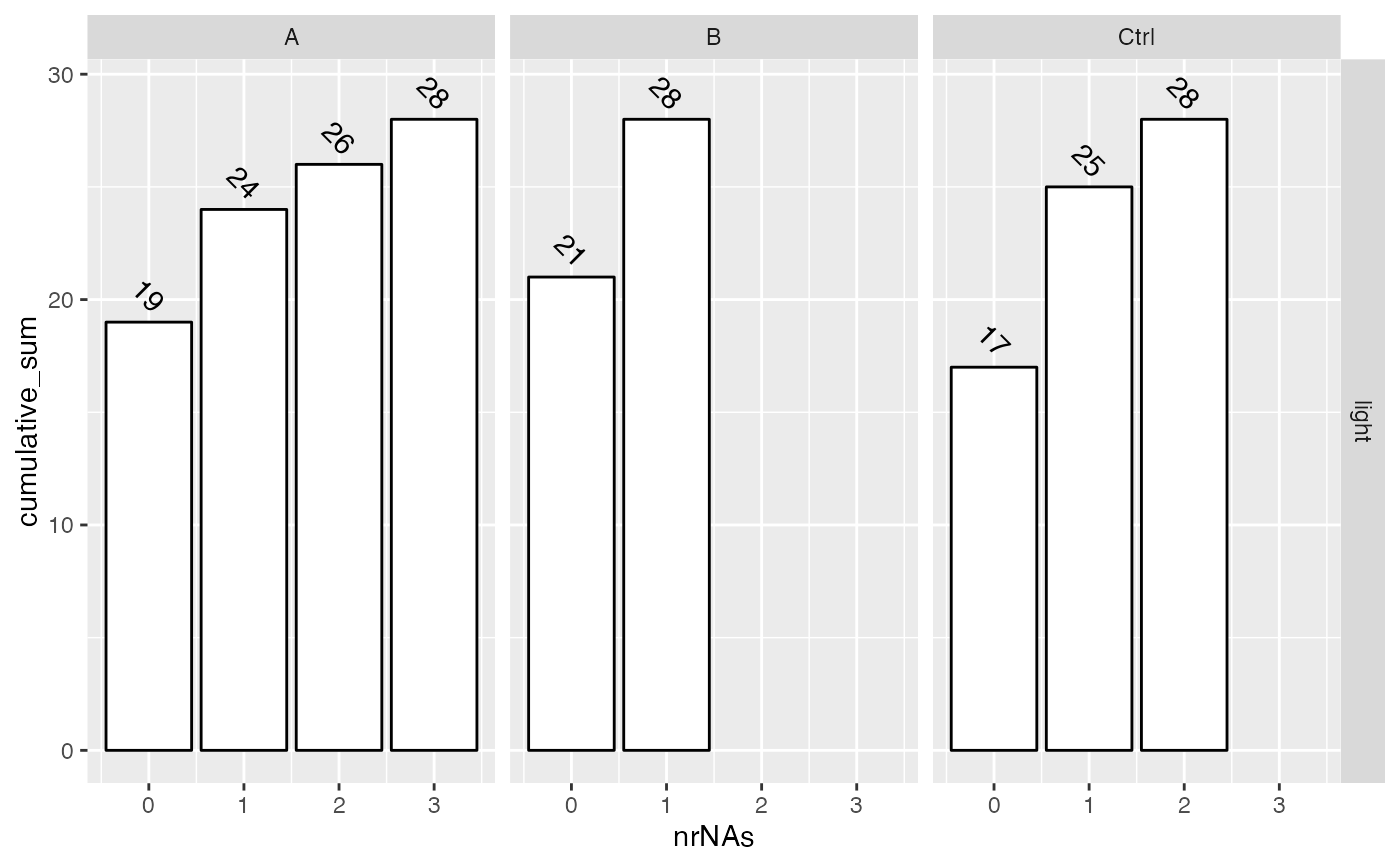
Method plot_missingness_per_group_cumsum()
barplot with cumulative sum of features with 1,2, etc missing in condition
Method percentage_abundance()
Does roll up to highest hierarchy and Computes the percent abundance of proteins overall and within each group
Examples
istar <- prolfqua::sim_lfq_data_peptide_config()
#> creating sampleName from file_name column
#> completing cases
#> completing cases done
#> setup done
data <- istar$data
lfqdata <- LFQData$new(data, istar$config)
sum <- lfqdata$get_Summariser()
sum
#> <LFQDataSummariser>
#> Public:
#> clone: function (deep = FALSE)
#> hierarchy_counts: function ()
#> hierarchy_counts_sample: function (value = c("wide", "long"), nr_children = 1)
#> initialize: function (lfqdata)
#> interaction_missing_stats: function ()
#> lfq: LFQData, R6
#> missingness_per_group: function ()
#> missingness_per_group_cumsum: function ()
#> percentage_abundance: function ()
#> plot_hierarchy_counts_sample: function (nr_children = 1)
#> plot_missingness_per_group: function ()
#> plot_missingness_per_group_cumsum: function ()
#> upset_interaction_missing_stats: function (tr = 2)
sum$hierarchy_counts()
#> # A tibble: 1 × 3
#> isotopeLabel protein_Id peptide_Id
#> <chr> <int> <int>
#> 1 light 10 28
sum$hierarchy_counts_sample("wide")
#> # A tibble: 12 × 4
#> # Groups: isotopeLabel [1]
#> isotopeLabel sampleName protein_Id peptide_Id
#> <chr> <chr> <int> <int>
#> 1 light A_V1 10 23
#> 2 light A_V2 10 26
#> 3 light A_V3 10 25
#> 4 light A_V4 10 23
#> 5 light B_V1 8 26
#> 6 light B_V2 9 26
#> 7 light B_V3 10 27
#> 8 light B_V4 10 26
#> 9 light Ctrl_V1 10 24
#> 10 light Ctrl_V2 10 25
#> 11 light Ctrl_V3 9 24
#> 12 light Ctrl_V4 10 25
sum$hierarchy_counts_sample("long")
#> # A tibble: 24 × 4
#> # Groups: isotopeLabel [1]
#> isotopeLabel sampleName key nr
#> <chr> <chr> <chr> <int>
#> 1 light A_V1 protein_Id 10
#> 2 light A_V1 peptide_Id 23
#> 3 light A_V2 protein_Id 10
#> 4 light A_V2 peptide_Id 26
#> 5 light A_V3 protein_Id 10
#> 6 light A_V3 peptide_Id 25
#> 7 light A_V4 protein_Id 10
#> 8 light A_V4 peptide_Id 23
#> 9 light B_V1 protein_Id 8
#> 10 light B_V1 peptide_Id 26
#> # ℹ 14 more rows
sum$plot_hierarchy_counts_sample()
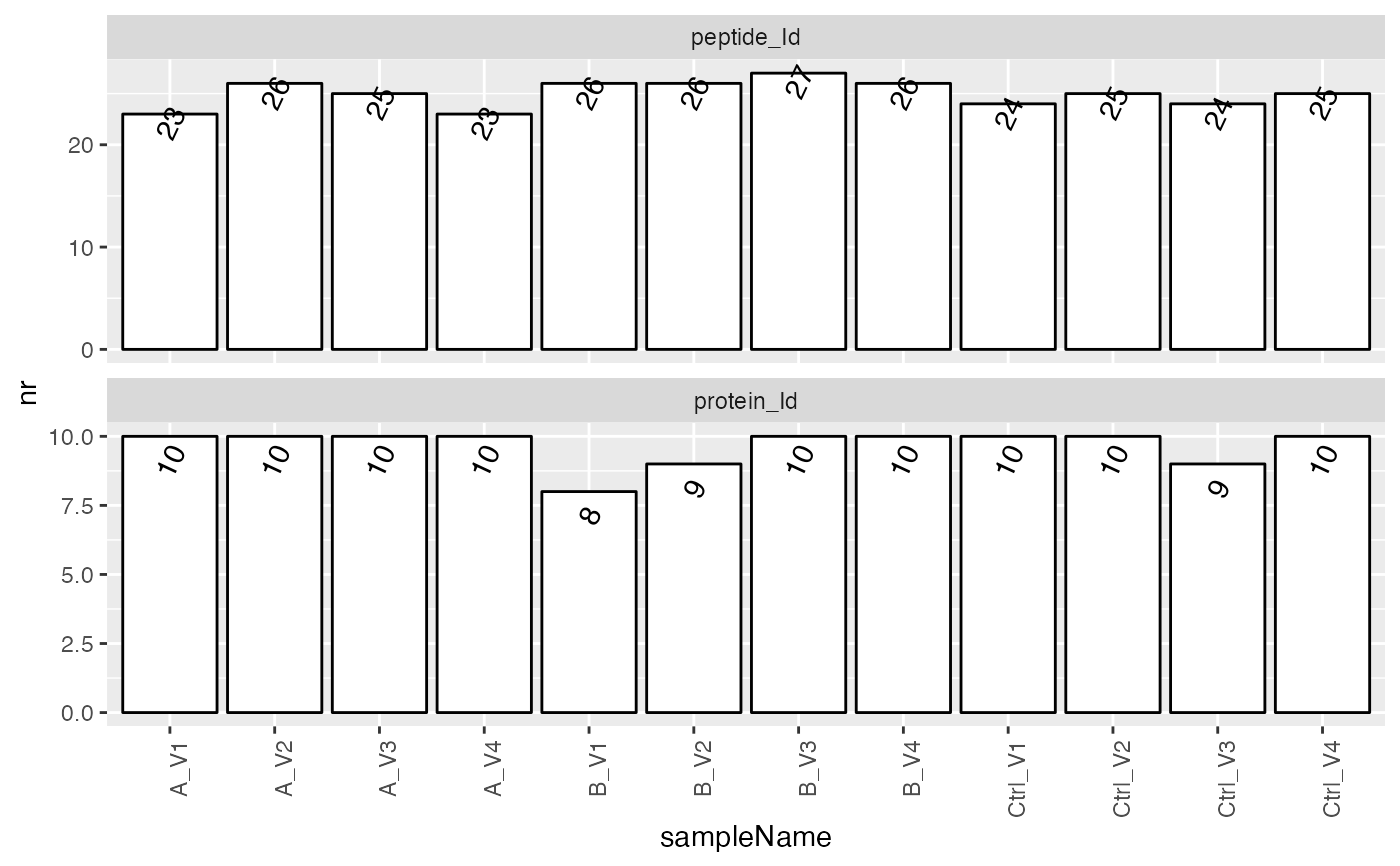 sum$plot_hierarchy_counts_sample()
 tmp <- sum$interaction_missing_stats()
sum$missingness_per_group()
#> # A tibble: 3 × 7
#> # Groups: isotopeLabel, group_ [3]
#> isotopeLabel group_ nrReplicates `0` `1` `2` `3`
#> <chr> <chr> <int> <int> <int> <int> <int>
#> 1 light A 4 19 5 2 2
#> 2 light B 4 21 7 NA NA
#> 3 light Ctrl 4 17 8 3 NA
sum$missingness_per_group_cumsum()
#> isotopeLabel ~ group_
#> # A tibble: 3 × 7
#> # Groups: isotopeLabel, group_ [3]
#> isotopeLabel group_ nrReplicates `0` `1` `2` `3`
#> <chr> <chr> <int> <int> <int> <int> <int>
#> 1 light A 4 19 24 26 28
#> 2 light B 4 21 28 NA NA
#> 3 light Ctrl 4 17 25 28 NA
sum$plot_missingness_per_group()
tmp <- sum$interaction_missing_stats()
sum$missingness_per_group()
#> # A tibble: 3 × 7
#> # Groups: isotopeLabel, group_ [3]
#> isotopeLabel group_ nrReplicates `0` `1` `2` `3`
#> <chr> <chr> <int> <int> <int> <int> <int>
#> 1 light A 4 19 5 2 2
#> 2 light B 4 21 7 NA NA
#> 3 light Ctrl 4 17 8 3 NA
sum$missingness_per_group_cumsum()
#> isotopeLabel ~ group_
#> # A tibble: 3 × 7
#> # Groups: isotopeLabel, group_ [3]
#> isotopeLabel group_ nrReplicates `0` `1` `2` `3`
#> <chr> <chr> <int> <int> <int> <int> <int>
#> 1 light A 4 19 24 26 28
#> 2 light B 4 21 28 NA NA
#> 3 light Ctrl 4 17 25 28 NA
sum$plot_missingness_per_group()
 sum$plot_missingness_per_group_cumsum()
#> isotopeLabel ~ group_
sum$plot_missingness_per_group_cumsum()
#> isotopeLabel ~ group_
 sum$upset_interaction_missing_stats()
 sum$percentage_abundance()
#> # A tibble: 112 × 17
#> protein_Id peptide_Id isotopeLabel group_ nrReplicates nrMeasured nrNAs sd
#> <chr> <chr> <chr> <chr> <int> <int> <int> <dbl>
#> 1 BEJI92~52… HBkZvdhT light All 12 8 4 1.35
#> 2 DoWup2~58… KVUnZ6oZ light All 12 12 0 2.55
#> 3 Fl4JiV~86… KpyeEoiy light All 12 10 2 1.30
#> 4 0EfVhX~00… dJkdz7so light All 12 9 3 4.36
#> 5 Fl4JiV~86… fv2Ck8hz light All 12 8 4 4.31
#> 6 9VUkAq~47… eIC06D7g light All 12 11 1 4.97
#> 7 Fl4JiV~86… GsUIOl6Q light All 12 10 2 3.29
#> 8 HvIpHG~90… opjydeWJ light All 12 10 2 3.16
#> 9 SGIVBl~57… 03kMlNn1 light All 12 9 3 1.24
#> 10 BEJI92~52… qQ1GK8Un light All 12 11 1 3.69
#> # ℹ 102 more rows
#> # ℹ 9 more variables: var <dbl>, meanAbundance <dbl>, medianAbundance <dbl>,
#> # CV <dbl>, interaction <chr>, id <int>, abundance_percent <dbl>,
#> # abundance_percent_cumulative <dbl>, percent_prot <dbl>
sum$percentage_abundance()
#> # A tibble: 112 × 17
#> protein_Id peptide_Id isotopeLabel group_ nrReplicates nrMeasured nrNAs sd
#> <chr> <chr> <chr> <chr> <int> <int> <int> <dbl>
#> 1 BEJI92~52… HBkZvdhT light All 12 8 4 1.35
#> 2 DoWup2~58… KVUnZ6oZ light All 12 12 0 2.55
#> 3 Fl4JiV~86… KpyeEoiy light All 12 10 2 1.30
#> 4 0EfVhX~00… dJkdz7so light All 12 9 3 4.36
#> 5 Fl4JiV~86… fv2Ck8hz light All 12 8 4 4.31
#> 6 9VUkAq~47… eIC06D7g light All 12 11 1 4.97
#> 7 Fl4JiV~86… GsUIOl6Q light All 12 10 2 3.29
#> 8 HvIpHG~90… opjydeWJ light All 12 10 2 3.16
#> 9 SGIVBl~57… 03kMlNn1 light All 12 9 3 1.24
#> 10 BEJI92~52… qQ1GK8Un light All 12 11 1 3.69
#> # ℹ 102 more rows
#> # ℹ 9 more variables: var <dbl>, meanAbundance <dbl>, medianAbundance <dbl>,
#> # CV <dbl>, interaction <chr>, id <int>, abundance_percent <dbl>,
#> # abundance_percent_cumulative <dbl>, percent_prot <dbl>