AggregateTopN
AggregateTopN
Details
Aggregates peptide intensities to protein level using top N peptides. Works with raw (untransformed) intensities.
Public fields
lfqLFQData
lfq_aggaggregation result
prefixto use for aggregation results e.g. protein
Ntop N peptides by intensity
funcaggregation function name: "sum" or "mean"
Methods
Method plot()
creates aggregation plots
Method write_plots()
writes plots to folder
Usage
AggregateTopN$write_plots(
  qcpath,
  subset = NULL,
  show.legend = FALSE,
  width = 6,
  height = 6
)Examples
istar <- prolfqua::sim_lfq_data_peptide_config()
#> creating sampleName from file_name column
#> completing cases
#> completing cases done
#> setup done
data <- istar$data |> dplyr::filter(protein_Id %in% sample(protein_Id, 100))
lfqdata <- LFQData$new(data, istar$config)
agg <- AggregateTopN$new(lfqdata, "protein", N = 3, func = "sum")
agg$aggregate()
#> Joining with `by = join_by(protein_Id, peptide_Id)`
#> Columns added : srm_meanInt srm_meanIntRank
#> completing cases
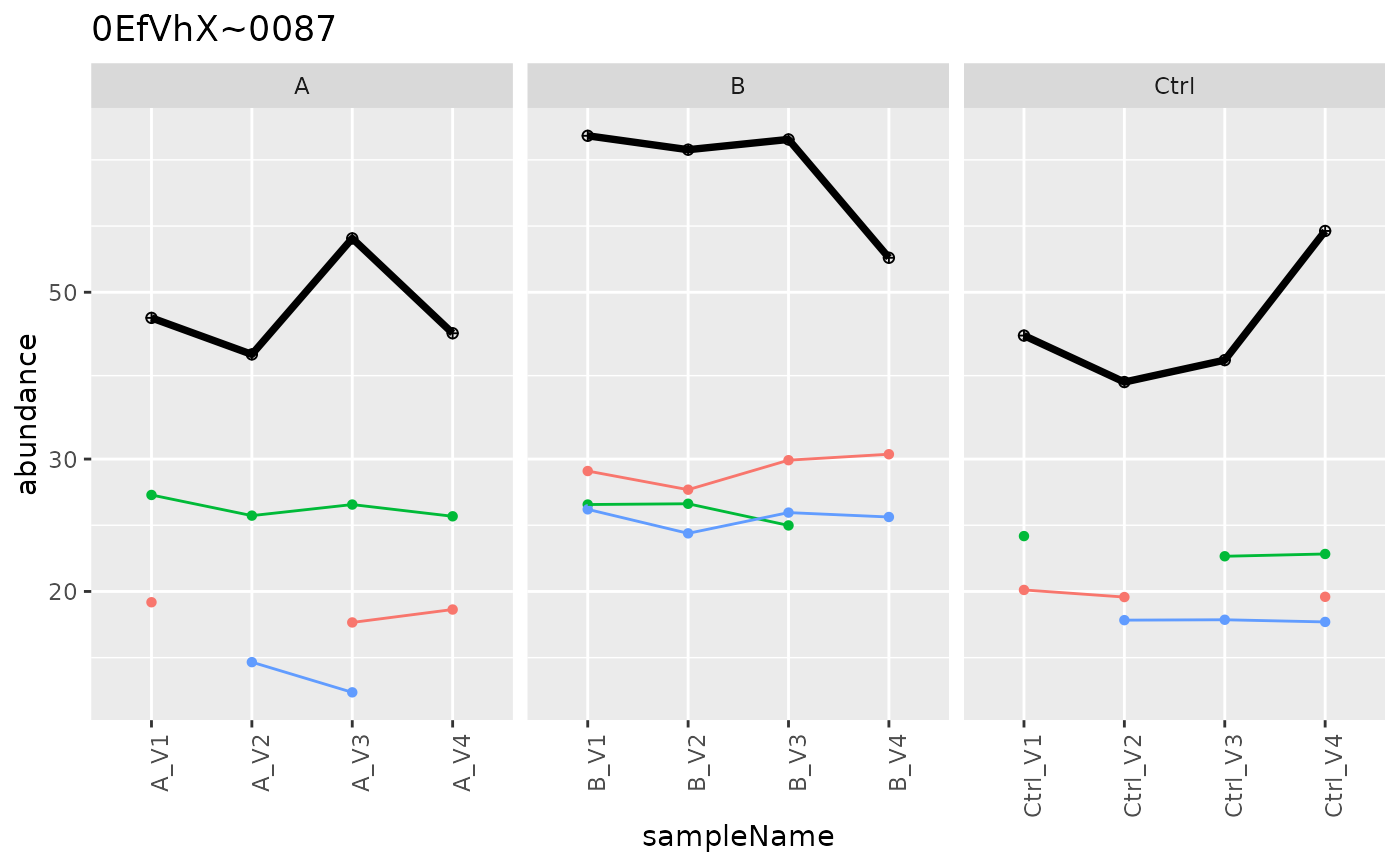
p <- agg$plot()
p$plots[[1]]
#> Warning: Removed 7 rows containing missing values or values outside the scale range
#> (`geom_point()`).
#> Warning: Removed 4 rows containing missing values or values outside the scale range
#> (`geom_line()`).
 agg_mean <- AggregateTopN$new(lfqdata, "protein", N = 3, func = "mean")
agg_mean$aggregate()
#> Joining with `by = join_by(protein_Id, peptide_Id)`
#> Columns added : srm_meanInt srm_meanIntRank
#> completing cases
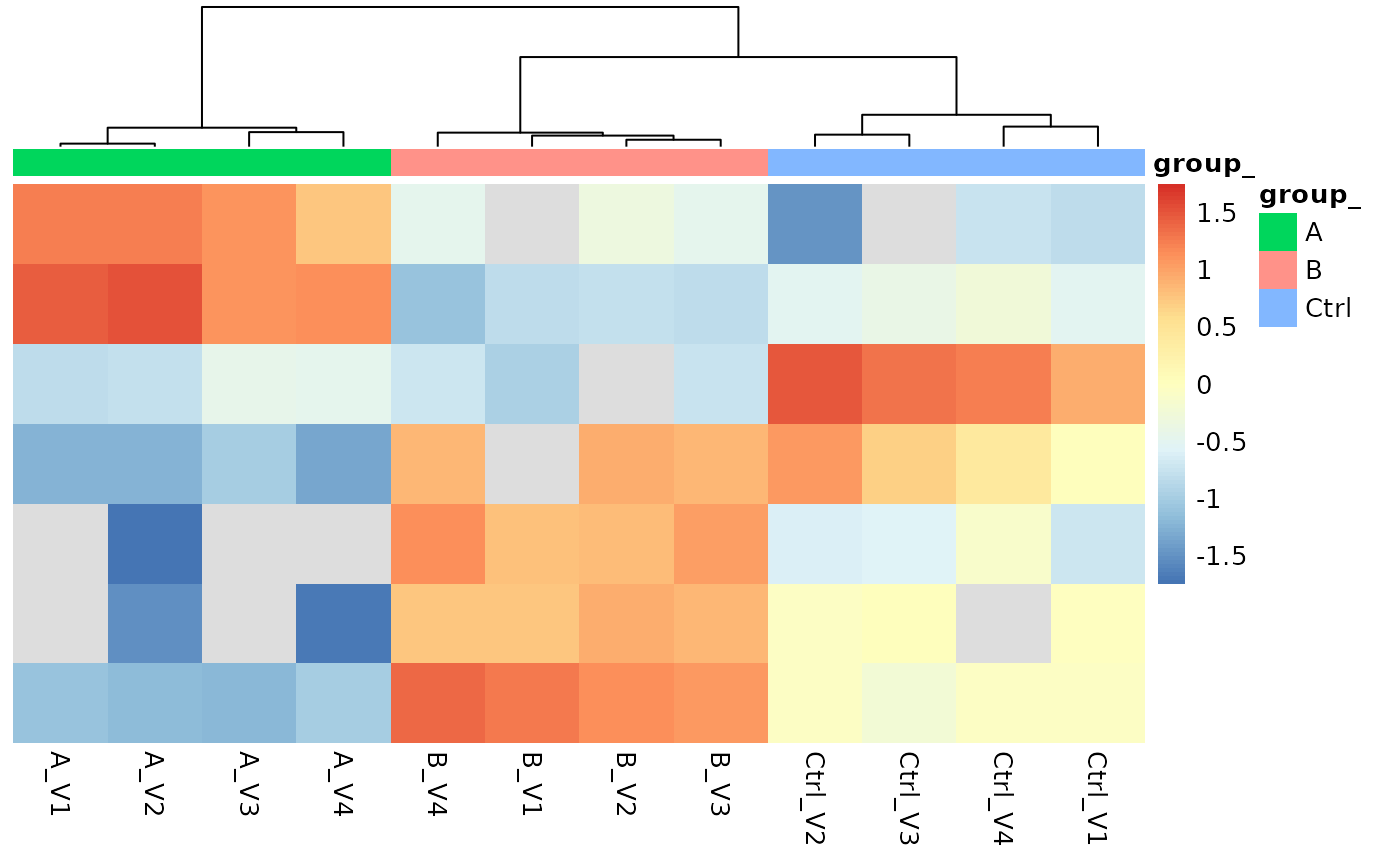
protPlotter <- agg_mean$lfq_agg$get_Plotter()
protPlotter$heatmap()
agg_mean <- AggregateTopN$new(lfqdata, "protein", N = 3, func = "mean")
agg_mean$aggregate()
#> Joining with `by = join_by(protein_Id, peptide_Id)`
#> Columns added : srm_meanInt srm_meanIntRank
#> completing cases
protPlotter <- agg_mean$lfq_agg$get_Plotter()
protPlotter$heatmap()
 agg_mean$write_plots(tempdir())
#> Warning: Removed 7 rows containing missing values or values outside the scale range
#> (`geom_point()`).
#> Warning: Removed 4 rows containing missing values or values outside the scale range
#> (`geom_line()`).
#> Warning: Removed 2 rows containing missing values or values outside the scale range
#> (`geom_point()`).
#> Warning: Removed 1 row containing missing values or values outside the scale range
#> (`geom_line()`).
#> Warning: Removed 1 row containing missing values or values outside the scale range
#> (`geom_line()`).
#> Warning: Removed 2 rows containing missing values or values outside the scale range
#> (`geom_point()`).
#> Warning: Removed 1 row containing missing values or values outside the scale range
#> (`geom_point()`).
#> Warning: Removed 1 row containing missing values or values outside the scale range
#> (`geom_point()`).
#> Warning: Removed 5 rows containing missing values or values outside the scale range
#> (`geom_point()`).
#> Warning: Removed 3 rows containing missing values or values outside the scale range
#> (`geom_line()`).
#> Warning: Removed 1 row containing missing values or values outside the scale range
#> (`geom_point()`).
#> Warning: Removed 1 row containing missing values or values outside the scale range
#> (`geom_line()`).
#> Warning: Removed 1 row containing missing values or values outside the scale range
#> (`geom_line()`).
#> Warning: Removed 1 row containing missing values or values outside the scale range
#> (`geom_point()`).
#> Warning: Removed 8 rows containing missing values or values outside the scale range
#> (`geom_point()`).
#> Warning: Removed 6 rows containing missing values or values outside the scale range
#> (`geom_line()`).
#> Warning: Removed 3 rows containing missing values or values outside the scale range
#> (`geom_point()`).
#> Warning: Removed 2 rows containing missing values or values outside the scale range
#> (`geom_line()`).
#> Warning: Removed 9 rows containing missing values or values outside the scale range
#> (`geom_point()`).
#> Warning: Removed 7 rows containing missing values or values outside the scale range
#> (`geom_line()`).
agg_mean$write_plots(tempdir())
#> Warning: Removed 7 rows containing missing values or values outside the scale range
#> (`geom_point()`).
#> Warning: Removed 4 rows containing missing values or values outside the scale range
#> (`geom_line()`).
#> Warning: Removed 2 rows containing missing values or values outside the scale range
#> (`geom_point()`).
#> Warning: Removed 1 row containing missing values or values outside the scale range
#> (`geom_line()`).
#> Warning: Removed 1 row containing missing values or values outside the scale range
#> (`geom_line()`).
#> Warning: Removed 2 rows containing missing values or values outside the scale range
#> (`geom_point()`).
#> Warning: Removed 1 row containing missing values or values outside the scale range
#> (`geom_point()`).
#> Warning: Removed 1 row containing missing values or values outside the scale range
#> (`geom_point()`).
#> Warning: Removed 5 rows containing missing values or values outside the scale range
#> (`geom_point()`).
#> Warning: Removed 3 rows containing missing values or values outside the scale range
#> (`geom_line()`).
#> Warning: Removed 1 row containing missing values or values outside the scale range
#> (`geom_point()`).
#> Warning: Removed 1 row containing missing values or values outside the scale range
#> (`geom_line()`).
#> Warning: Removed 1 row containing missing values or values outside the scale range
#> (`geom_line()`).
#> Warning: Removed 1 row containing missing values or values outside the scale range
#> (`geom_point()`).
#> Warning: Removed 8 rows containing missing values or values outside the scale range
#> (`geom_point()`).
#> Warning: Removed 6 rows containing missing values or values outside the scale range
#> (`geom_line()`).
#> Warning: Removed 3 rows containing missing values or values outside the scale range
#> (`geom_point()`).
#> Warning: Removed 2 rows containing missing values or values outside the scale range
#> (`geom_line()`).
#> Warning: Removed 9 rows containing missing values or values outside the scale range
#> (`geom_point()`).
#> Warning: Removed 7 rows containing missing values or values outside the scale range
#> (`geom_line()`).