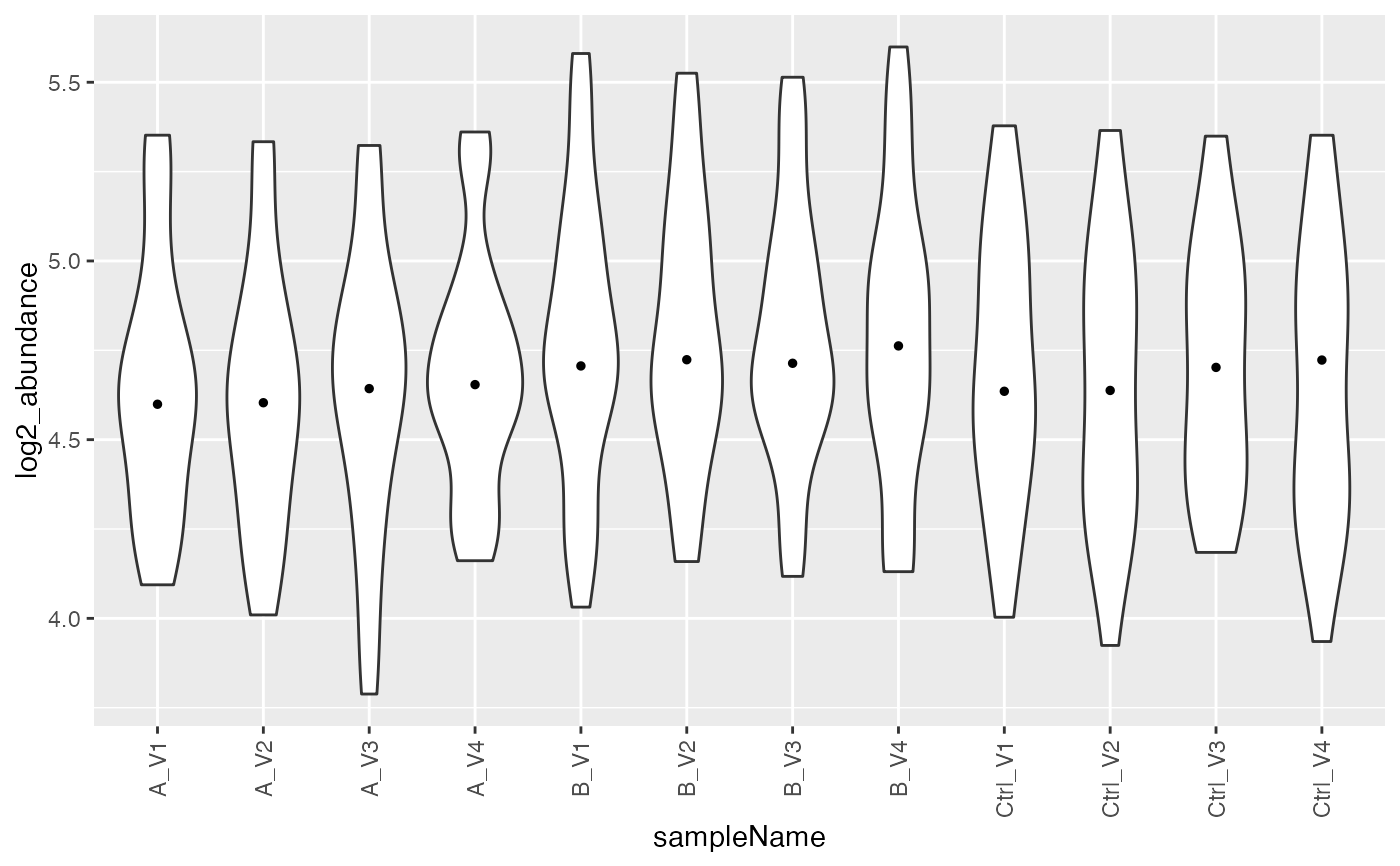
visualize intensity distributions
visualize intensity distributions
Usage
plot_intensity_distribution_violin(
  pdata,
  sample_name,
  response,
  is_transformed = FALSE
)

plot_intensity_distribution_density(
  pdata,
  sample_name,
  response,
  is_transformed = FALSE,
  legend = NA,
  max_legend_samples = 16
)
Arguments
- pdata
data.frame
- sample_name
character — sample column name
- response
character — intensity column name
- is_transformed
logical — is intensity log-transformed?
- legend
show legend. If `NA`, hide automatically when the number of samples is larger than `max_legend_samples`.
- max_legend_samples
maximum number of samples for automatic legend display.
See also
Other plotting:
ContrastsPlotter,
INTERNAL_FUNCTIONS_BY_FAMILY,
missigness_histogram(),
missingness_per_condition(),
missingness_per_condition_cumsum(),
plot_estimate(),
plot_heatmap(),
plot_heatmap_cor(),
plot_hierarchies_boxplot_df(),
plot_hierarchies_line(),
plot_na_heatmap(),
plot_pca(),
plot_raster(),
plot_sample_correlation(),
upset_interaction_missing_stats(),
upset_missing_stats()
Other plotting:
ContrastsPlotter,
INTERNAL_FUNCTIONS_BY_FAMILY,
missigness_histogram(),
missingness_per_condition(),
missingness_per_condition_cumsum(),
plot_estimate(),
plot_heatmap(),
plot_heatmap_cor(),
plot_hierarchies_boxplot_df(),
plot_hierarchies_line(),
plot_na_heatmap(),
plot_pca(),
plot_raster(),
plot_sample_correlation(),
upset_interaction_missing_stats(),
upset_missing_stats()
Examples
istar <- sim_lfq_data_peptide_config()
#> creating sampleName from file_name column
#> completing cases
#> completing cases done
#> setup done
lfq <- LFQData$new(istar$data, istar$config)
plot_intensity_distribution_violin(
lfq$data_long(), lfq$sample_name(), lfq$response(), lfq$is_transformed())
#> Warning: Removed 36 rows containing non-finite outside the scale range
#> (`stat_ydensity()`).
#> Warning: Removed 36 rows containing non-finite outside the scale range
#> (`stat_summary()`).
 istar <- sim_lfq_data_peptide_config()
#> creating sampleName from file_name column
#> completing cases
#> completing cases done
#> setup done
lfq <- LFQData$new(istar$data, istar$config)
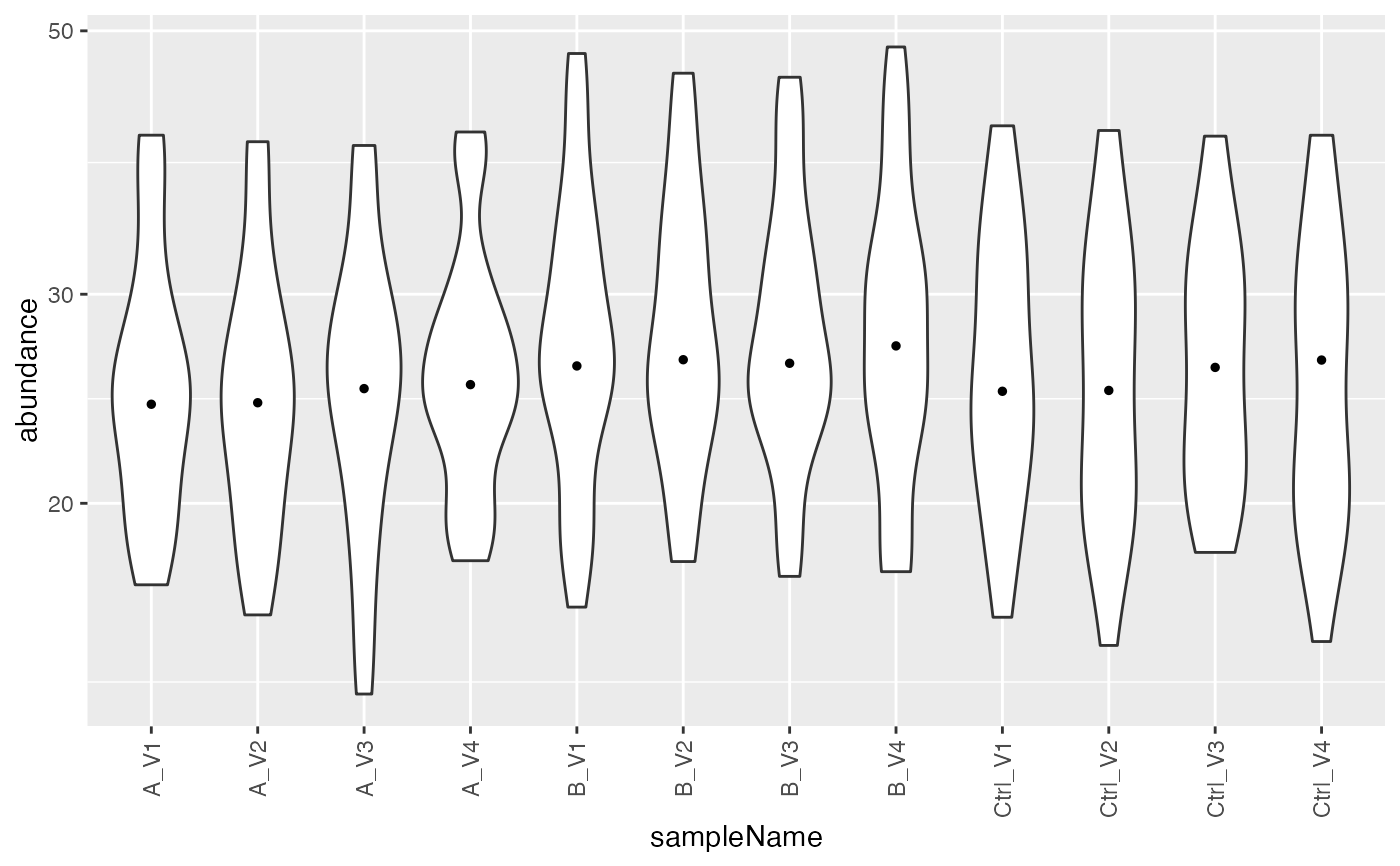
plot_intensity_distribution_density(
lfq$data_long(), lfq$sample_name(), lfq$response(), lfq$is_transformed())
#> Warning: Removed 36 rows containing non-finite outside the scale range
#> (`stat_density()`).
istar <- sim_lfq_data_peptide_config()
#> creating sampleName from file_name column
#> completing cases
#> completing cases done
#> setup done
lfq <- LFQData$new(istar$data, istar$config)
plot_intensity_distribution_density(
lfq$data_long(), lfq$sample_name(), lfq$response(), lfq$is_transformed())
#> Warning: Removed 36 rows containing non-finite outside the scale range
#> (`stat_density()`).