Plot peptide intensities of protein as a function of the sample and factor
Source:R/tidyMS_aggregation.R
plot_hierarchies_line.RdPlot peptide intensities of protein as a function of the sample and factor
plot_hierarchies_line(
  res,
  proteinName,
  config,
  separate = FALSE,
  show.legend = FALSE
)
Arguments
See also
Other aggregation:
INTERNAL_FUNCTIONS_BY_FAMILY,
aggregate_intensity_topN(),
estimate_intensity(),
intensity_summary_by_hkeys(),
medpolish_estimate(),
medpolish_estimate_df(),
medpolish_estimate_dfconfig(),
medpolish_protein_estimates(),
plot_estimate(),
plot_hierarchies_add_quantline(),
plot_hierarchies_line_df(),
rlm_estimate(),
rlm_estimate_dfconfig()
Other plotting:
ContrastsPlotter,
INTERNAL_FUNCTIONS_BY_FAMILY,
UpSet_interaction_missing_stats(),
UpSet_missing_stats(),
medpolish_estimate_df(),
missigness_histogram(),
missingness_per_condition(),
missingness_per_condition_cumsum(),
plot_NA_heatmap(),
plot_estimate(),
plot_heatmap(),
plot_heatmap_cor(),
plot_heatmap_cor_iheatmap(),
plot_hierarchies_add_quantline(),
plot_hierarchies_boxplot_df(),
plot_hierarchies_line_df(),
plot_intensity_distribution_violin(),
plot_pca(),
plot_raster(),
plot_sample_correlation(),
plot_screeplot()
Examples
istar <- sim_lfq_data_peptide_config()
#> creating sampleName from fileName column
#> completing cases
#> completing cases done
#> setup done
config <- istar$config
analysis <- istar$data

xnested <- analysis |>
 dplyr::group_by_at(config$table$hierarchy_keys_depth()) |> tidyr::nest()

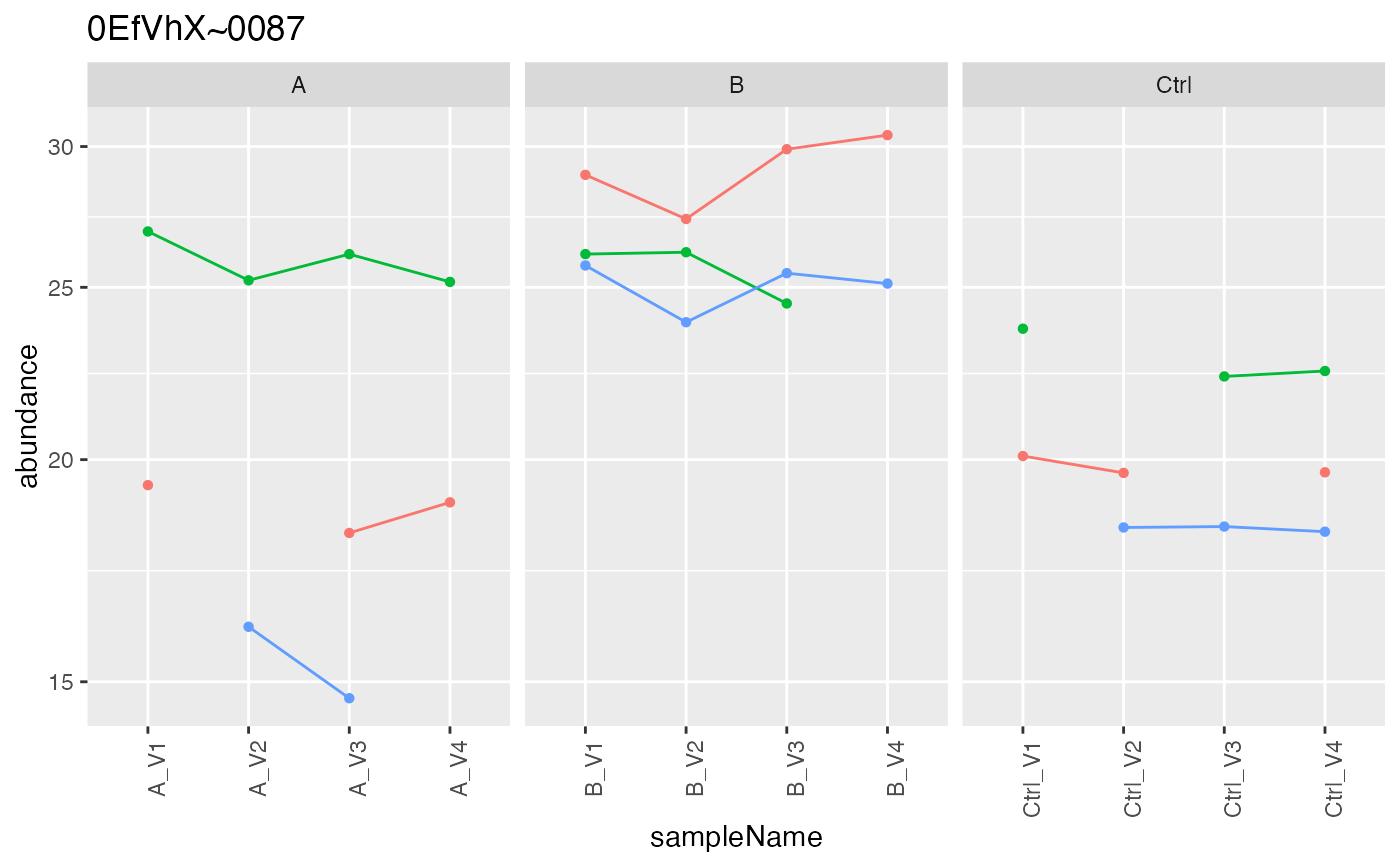
prolfqua::plot_hierarchies_line(xnested$data[[1]], xnested$protein_Id[[1]],config )
#> Warning: Removed 7 rows containing missing values or values outside the scale range
#> (`geom_point()`).
#> Warning: Removed 1 row containing missing values or values outside the scale range
#> (`geom_line()`).


bb <- prolfqua_data('data_skylineSRM_HL_A')
conf <- bb$config_f()
analysis <- bb$analysis(bb$data, conf)
#> creating sampleName from fileName column
#> Warning: no nr_children column specified in the data, adding column nr_children and setting to 1.
#> completing cases
#> completing cases done
#> setup done

nest <- analysis |> dplyr::group_by(conf$table$hierarchy_keys_depth()) |> tidyr::nest()
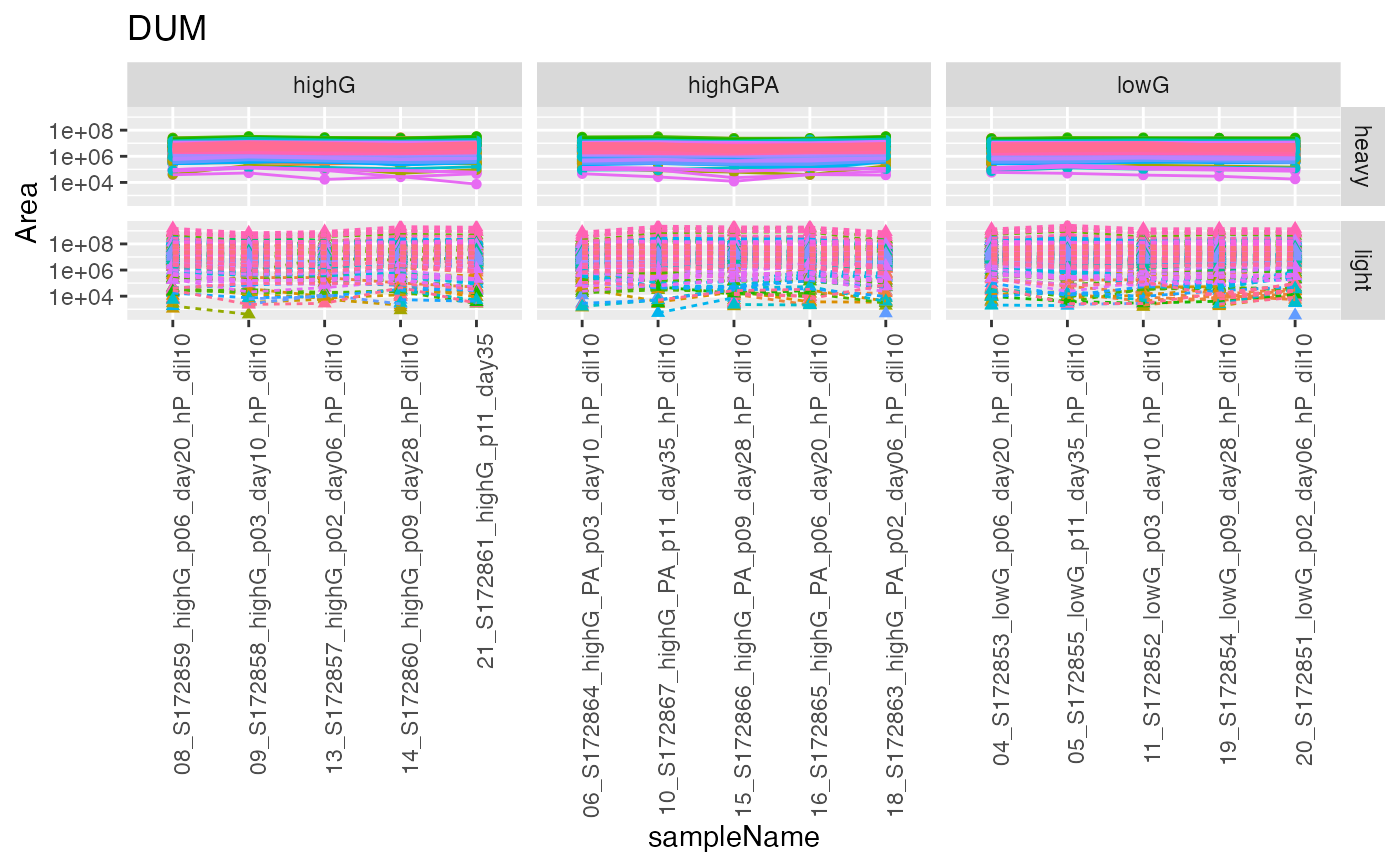
prolfqua::plot_hierarchies_line(nest$data[[1]],
                                  "DUM",
                                  conf,
                                  separate = TRUE)
#> Warning: Removed 802 rows containing missing values or values outside the scale range
#> (`geom_point()`).
#> Warning: Removed 462 rows containing missing values or values outside the scale range
#> (`geom_line()`).

prolfqua::plot_hierarchies_line(nest$data[[1]],
"DUM",
conf,
separate = TRUE,
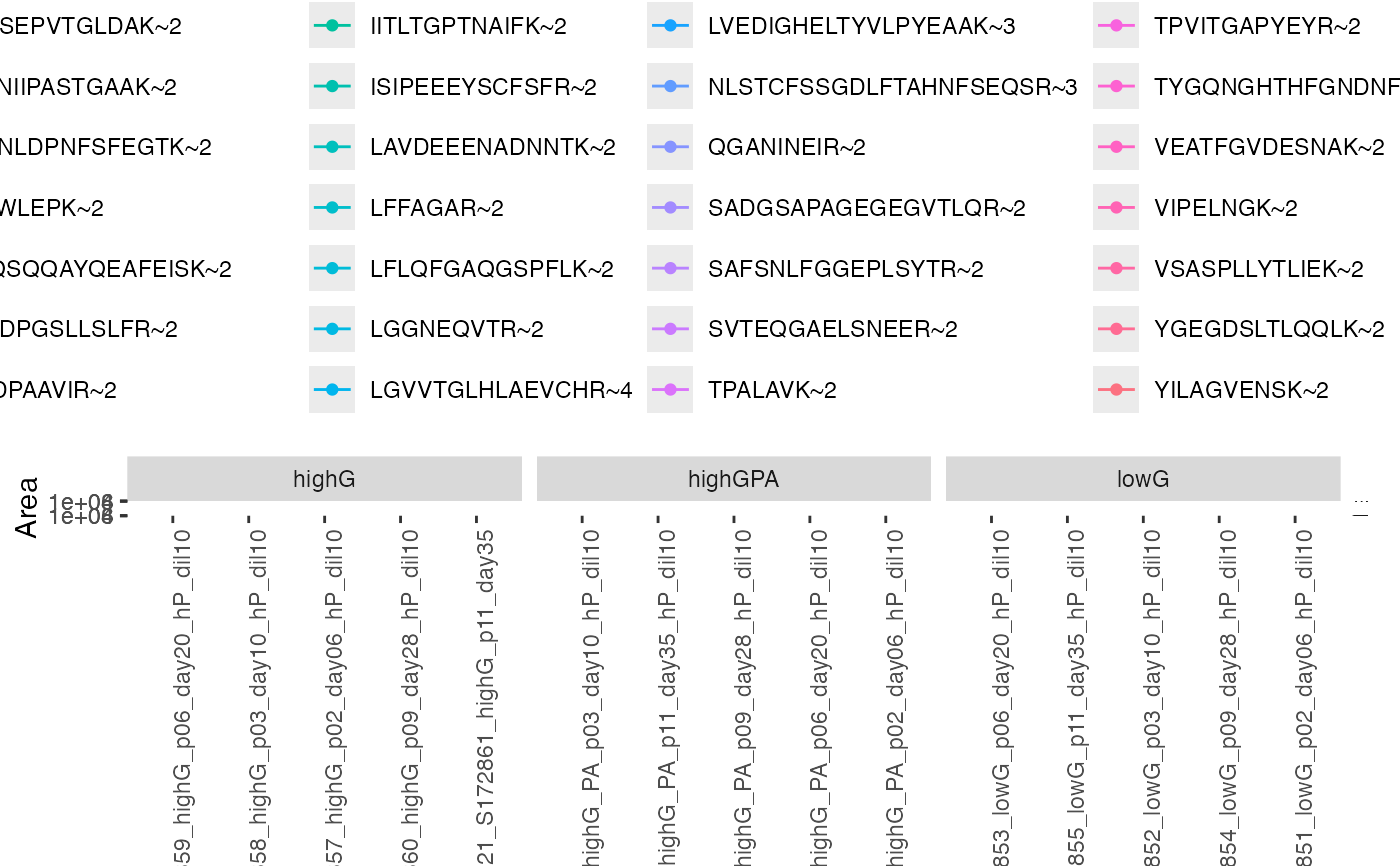
show.legend = TRUE)
#> Warning: Removed 802 rows containing missing values or values outside the scale range
#> (`geom_point()`).
#> Warning: Removed 462 rows containing missing values or values outside the scale range
#> (`geom_line()`).
