Add protein estimate to plot of peptide intensities
Source:R/tidyMS_aggregation.R
plot_hierarchies_add_quantline.RdAdd protein estimate to plot of peptide intensities
See also
Other aggregation:
INTERNAL_FUNCTIONS_BY_FAMILY,
aggregate_intensity_top_n(),
estimate_intensity(),
medpolish_estimate(),
medpolish_estimate_df(),
medpolish_estimate_dfconfig(),
plot_estimate(),
plot_hierarchies_line(),
plot_hierarchies_line_df(),
rlm_estimate(),
rlm_estimate_dfconfig()
Other plotting:
ContrastsPlotter,
INTERNAL_FUNCTIONS_BY_FAMILY,
medpolish_estimate_df(),
missigness_histogram(),
missingness_per_condition(),
missingness_per_condition_cumsum(),
plot_estimate(),
plot_heatmap(),
plot_heatmap_cor(),
plot_hierarchies_boxplot_df(),
plot_hierarchies_line(),
plot_hierarchies_line_df(),
plot_intensity_distribution_violin(),
plot_na_heatmap(),
plot_pca(),
plot_raster(),
plot_sample_correlation(),
upset_interaction_missing_stats(),
upset_missing_stats()
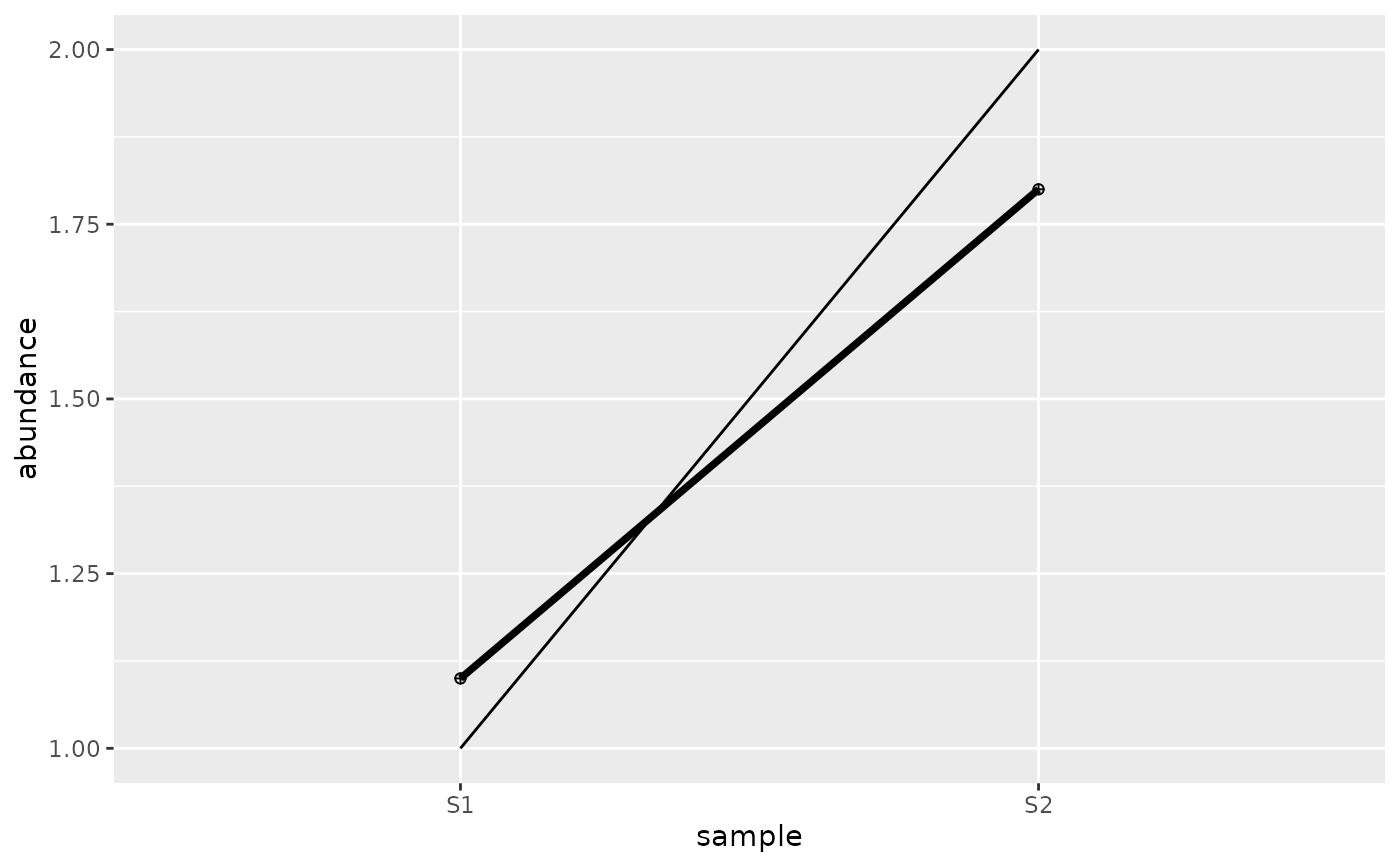
Examples
p <- ggplot2::ggplot(
  data.frame(sample = c("S1", "S2"), abundance = c(1, 2)),
  ggplot2::aes(x = sample, y = abundance, group = 1)
) +
  ggplot2::geom_line()
plot_hierarchies_add_quantline(
  p,
  data.frame(sample = c("S1", "S2"), estimate = c(1.1, 1.8)),
  aes_y = "estimate",
  sample_name = "sample"
)