plot screeplot
See also
Other plotting:
ContrastsPlotter,
INTERNAL_FUNCTIONS_BY_FAMILY,
UpSet_interaction_missing_stats(),
UpSet_missing_stats(),
medpolish_estimate_df(),
missigness_histogram(),
missingness_per_condition(),
missingness_per_condition_cumsum(),
plot_NA_heatmap(),
plot_estimate(),
plot_heatmap(),
plot_heatmap_cor(),
plot_heatmap_cor_iheatmap(),
plot_hierarchies_add_quantline(),
plot_hierarchies_boxplot_df(),
plot_hierarchies_line(),
plot_hierarchies_line_df(),
plot_intensity_distribution_violin(),
plot_pca(),
plot_raster(),
plot_sample_correlation()
Examples
istar <- sim_lfq_data_protein_config(with_missing = FALSE)
#> creating sampleName from fileName column
#> completing cases
#> completing cases done
#> setup done
config <- istar$config
analysis <- istar$data
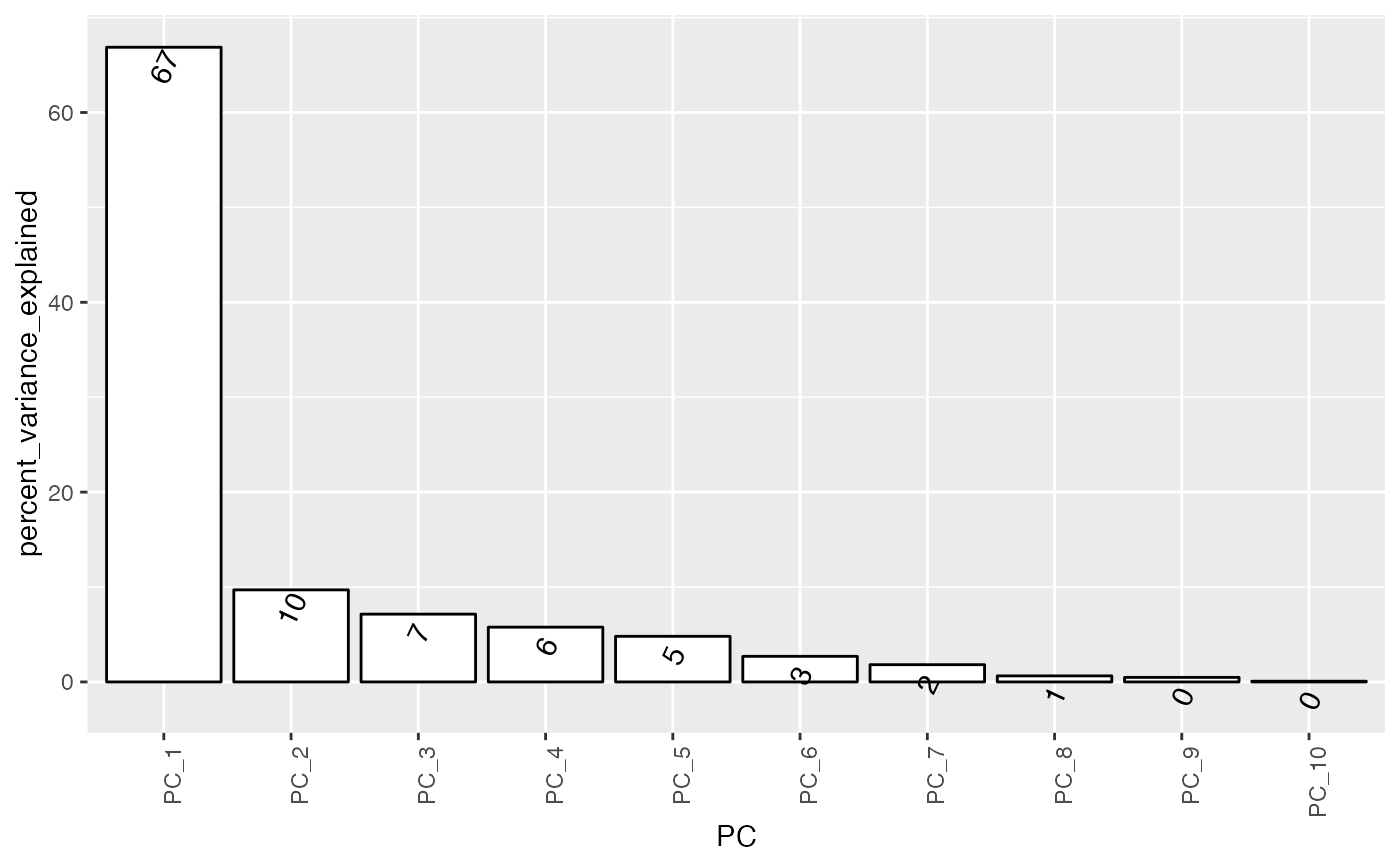
tmp <- plot_screeplot(analysis, config, threshold_pc= NULL)
print(tmp)
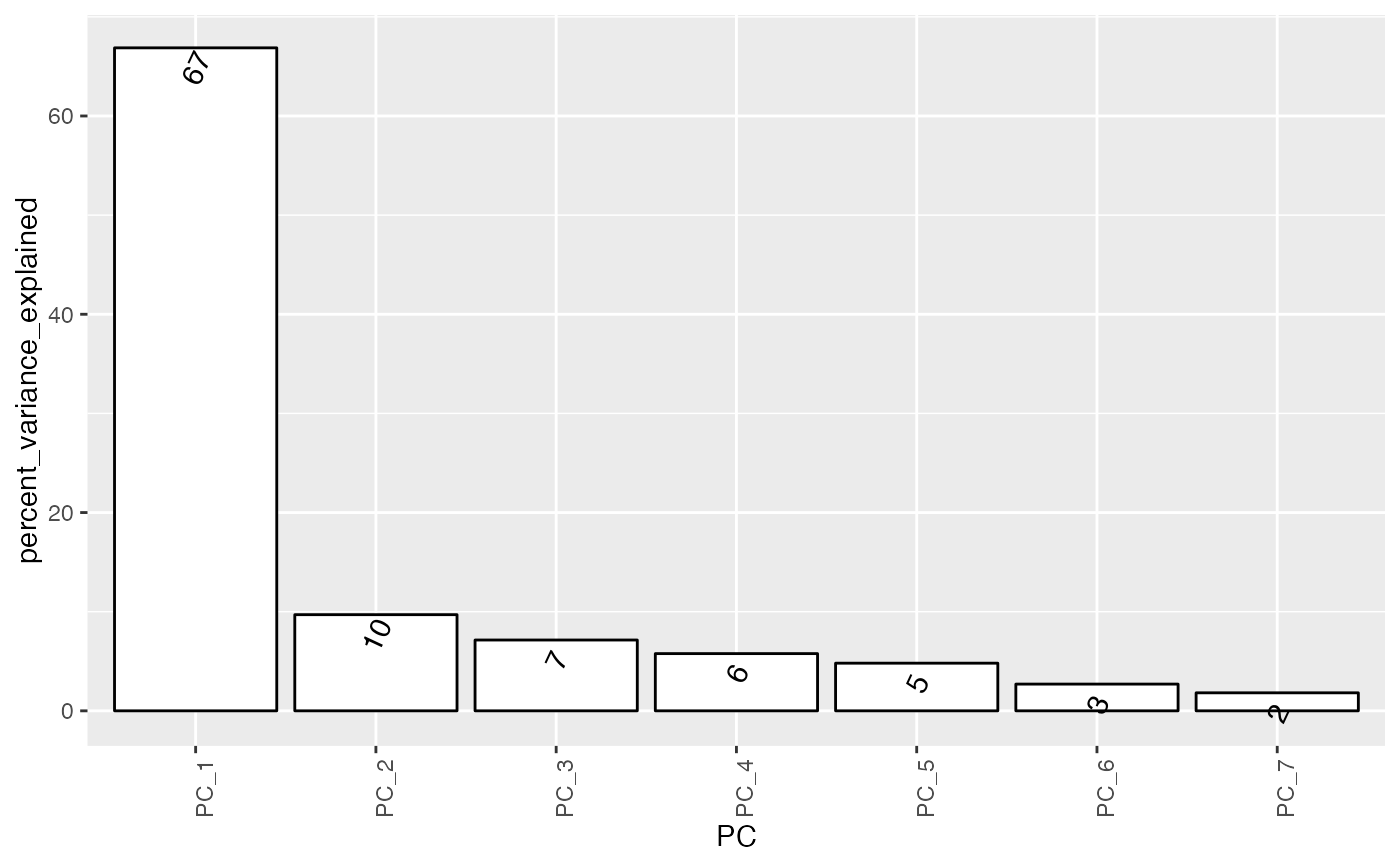
 tmp <- plot_screeplot(analysis, config, threshold_pc= 1)
print(tmp)
tmp <- plot_screeplot(analysis, config, threshold_pc= 1)
print(tmp)
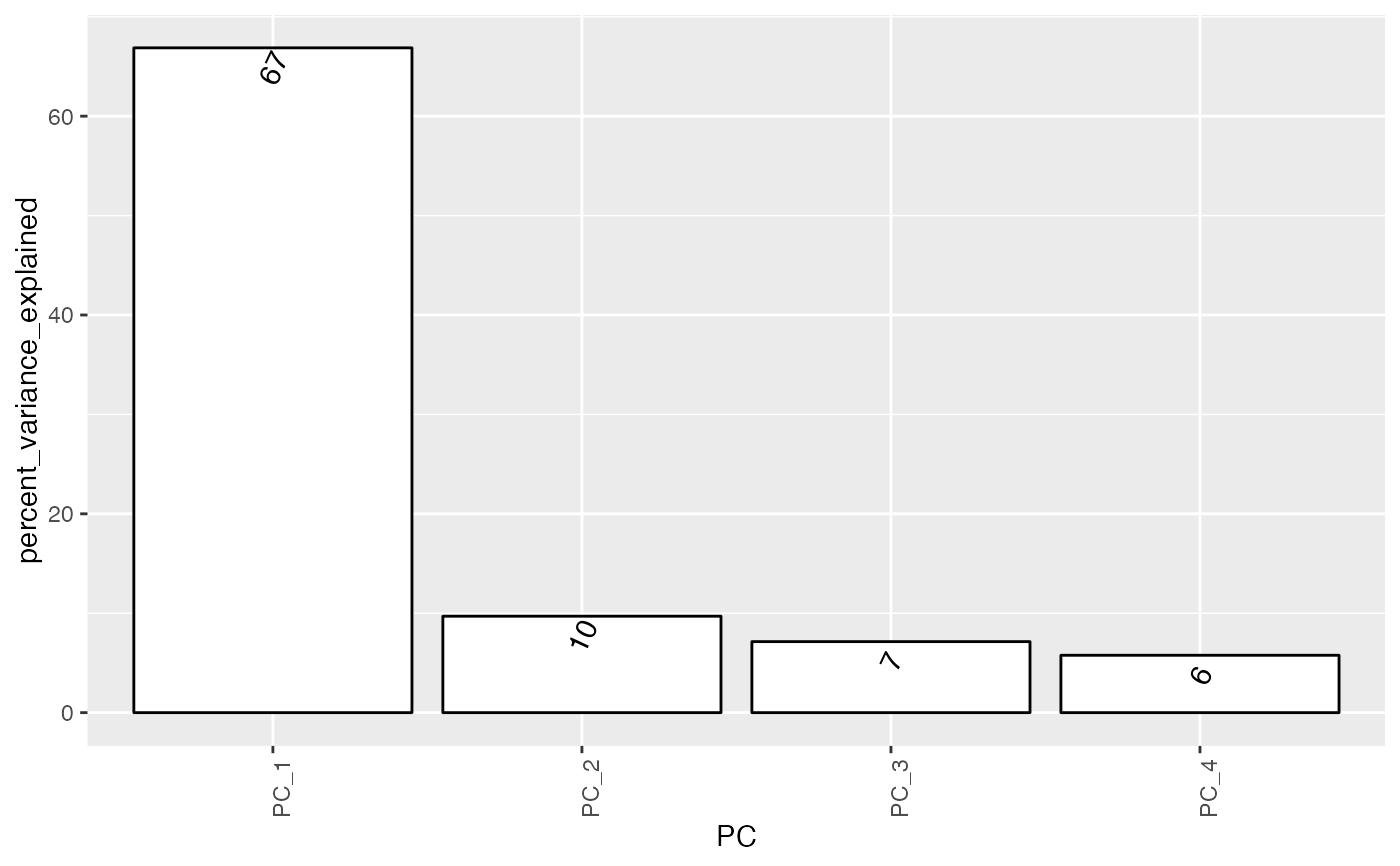
 tmp <- plot_screeplot(analysis, config, nr_PC = 4, threshold_pc = NULL)
print(tmp)
tmp <- plot_screeplot(analysis, config, nr_PC = 4, threshold_pc = NULL)
print(tmp)