plot Violin plot of sd CV or mean
Usage
plot_stat_violin(
  pdata,
  factor_keys_depth,
  stat = c("CV", "meanAbundance", "sd")
)Examples
bb1 <- prolfqua::sim_lfq_data_peptide_config()
#> creating sampleName from file_name column
#> completing cases
#> completing cases done
#> setup done
lfq <- LFQData$new(bb1$data, bb1$config)
res <- lfq$get_Stats()$stats()
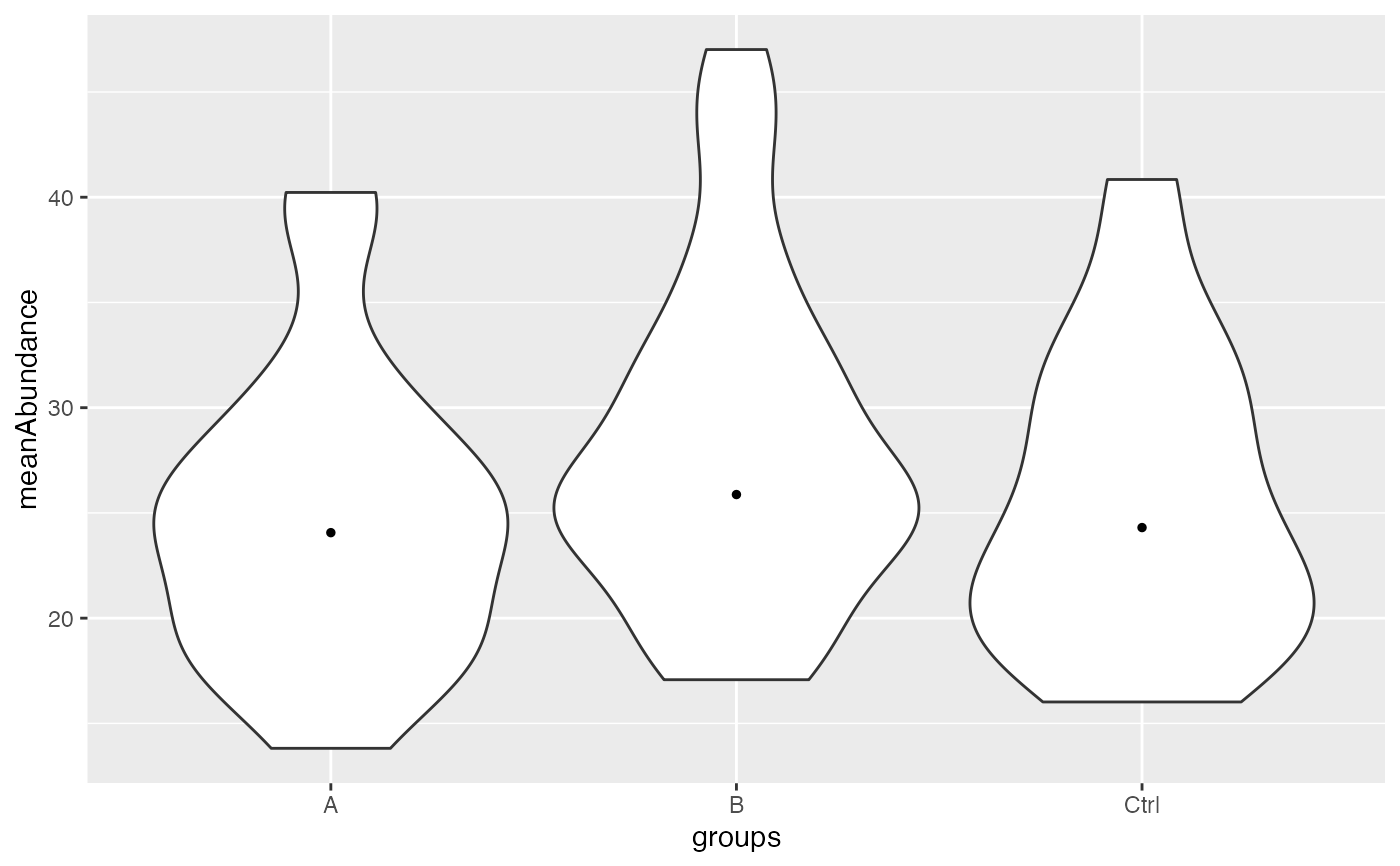
plot_stat_violin(res, lfq$relevant_factor_keys(), stat = "meanAbundance")
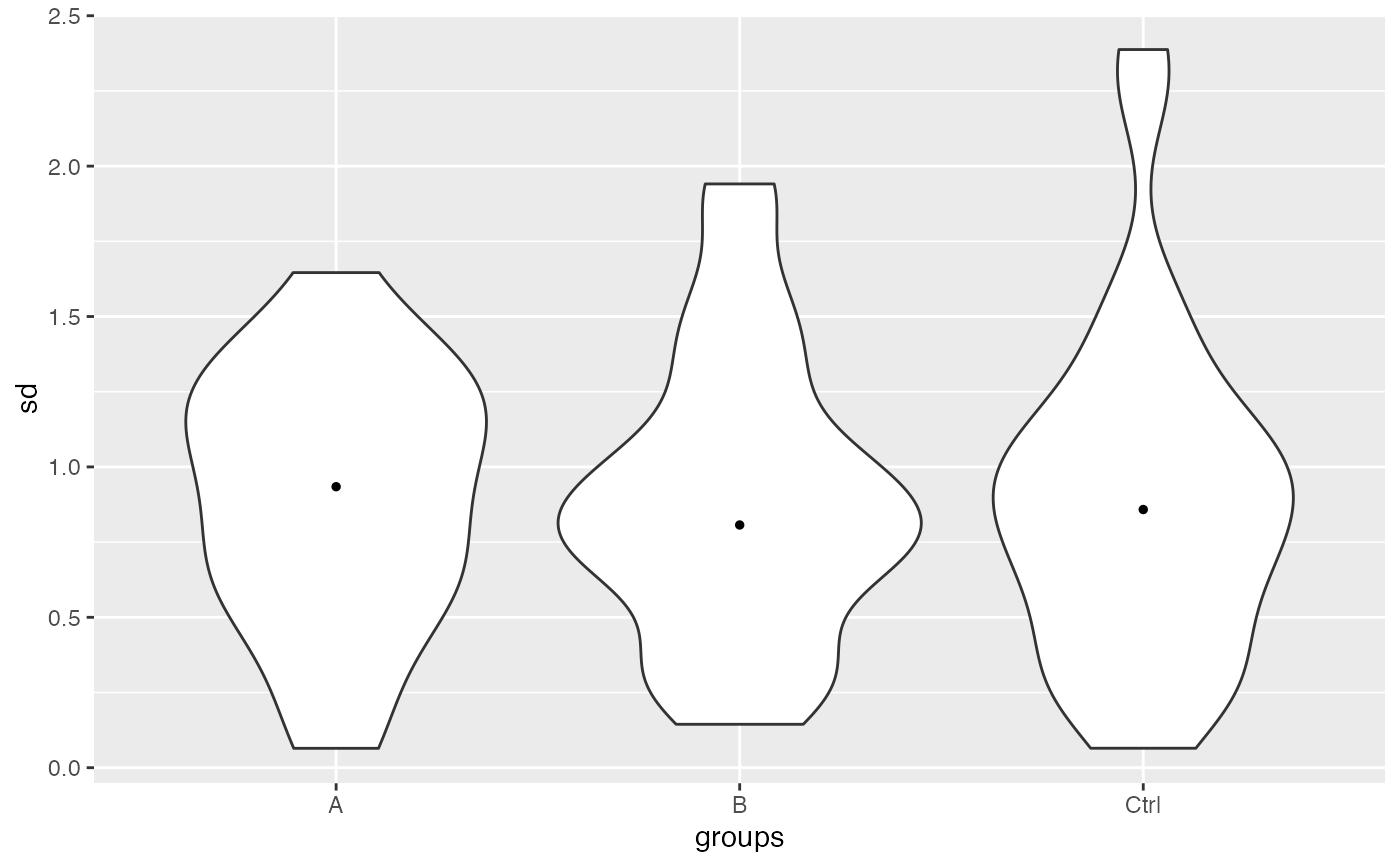
 plot_stat_violin(res, lfq$relevant_factor_keys(), stat = "sd")
#> Warning: Removed 2 rows containing non-finite outside the scale range
#> (`stat_ydensity()`).
#> Warning: Removed 2 rows containing non-finite outside the scale range
#> (`stat_summary()`).
plot_stat_violin(res, lfq$relevant_factor_keys(), stat = "sd")
#> Warning: Removed 2 rows containing non-finite outside the scale range
#> (`stat_ydensity()`).
#> Warning: Removed 2 rows containing non-finite outside the scale range
#> (`stat_summary()`).
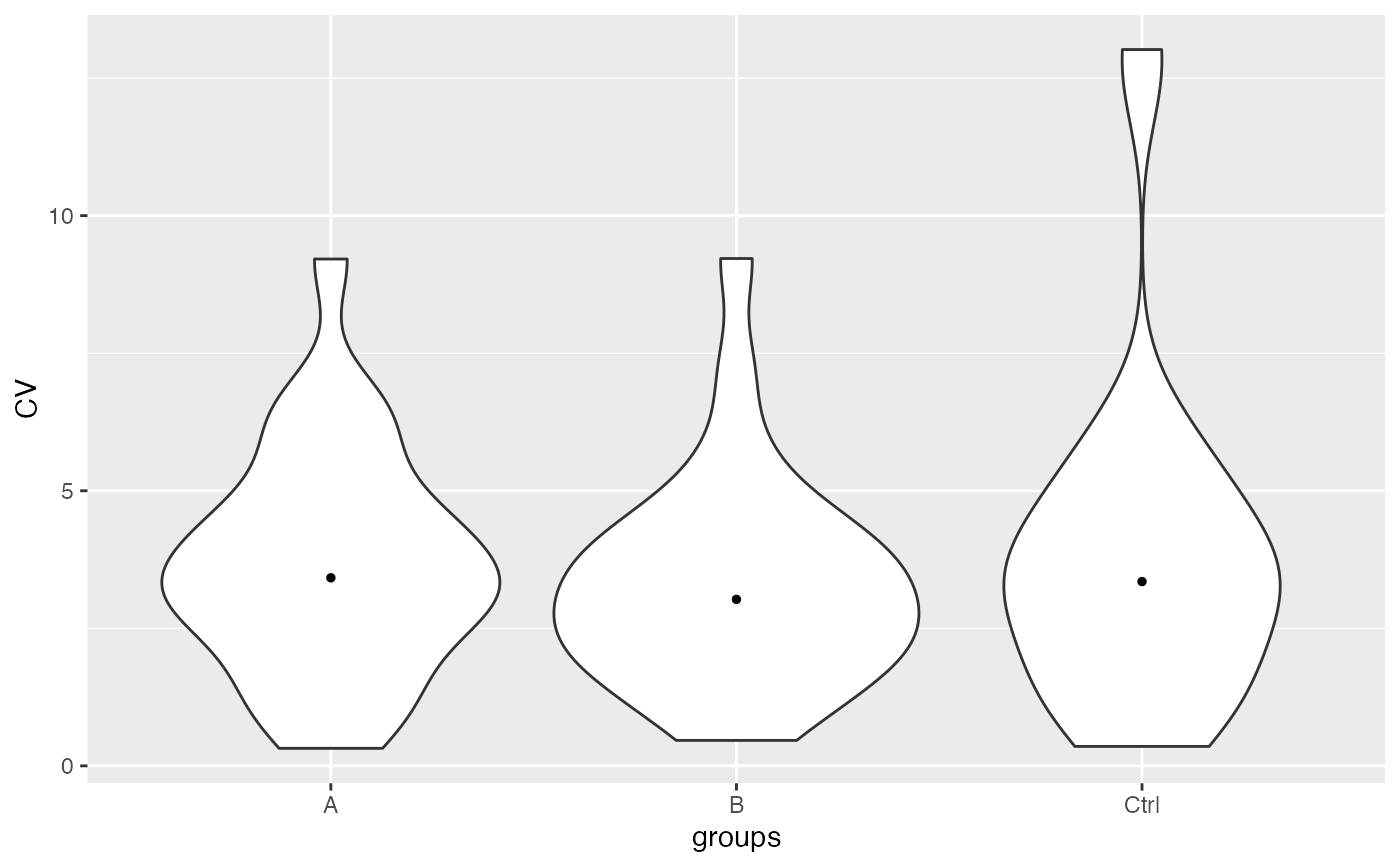
 plot_stat_violin(res, lfq$relevant_factor_keys(), stat = "CV")
#> Warning: Removed 2 rows containing non-finite outside the scale range
#> (`stat_ydensity()`).
#> Warning: Removed 2 rows containing non-finite outside the scale range
#> (`stat_summary()`).
plot_stat_violin(res, lfq$relevant_factor_keys(), stat = "CV")
#> Warning: Removed 2 rows containing non-finite outside the scale range
#> (`stat_ydensity()`).
#> Warning: Removed 2 rows containing non-finite outside the scale range
#> (`stat_summary()`).