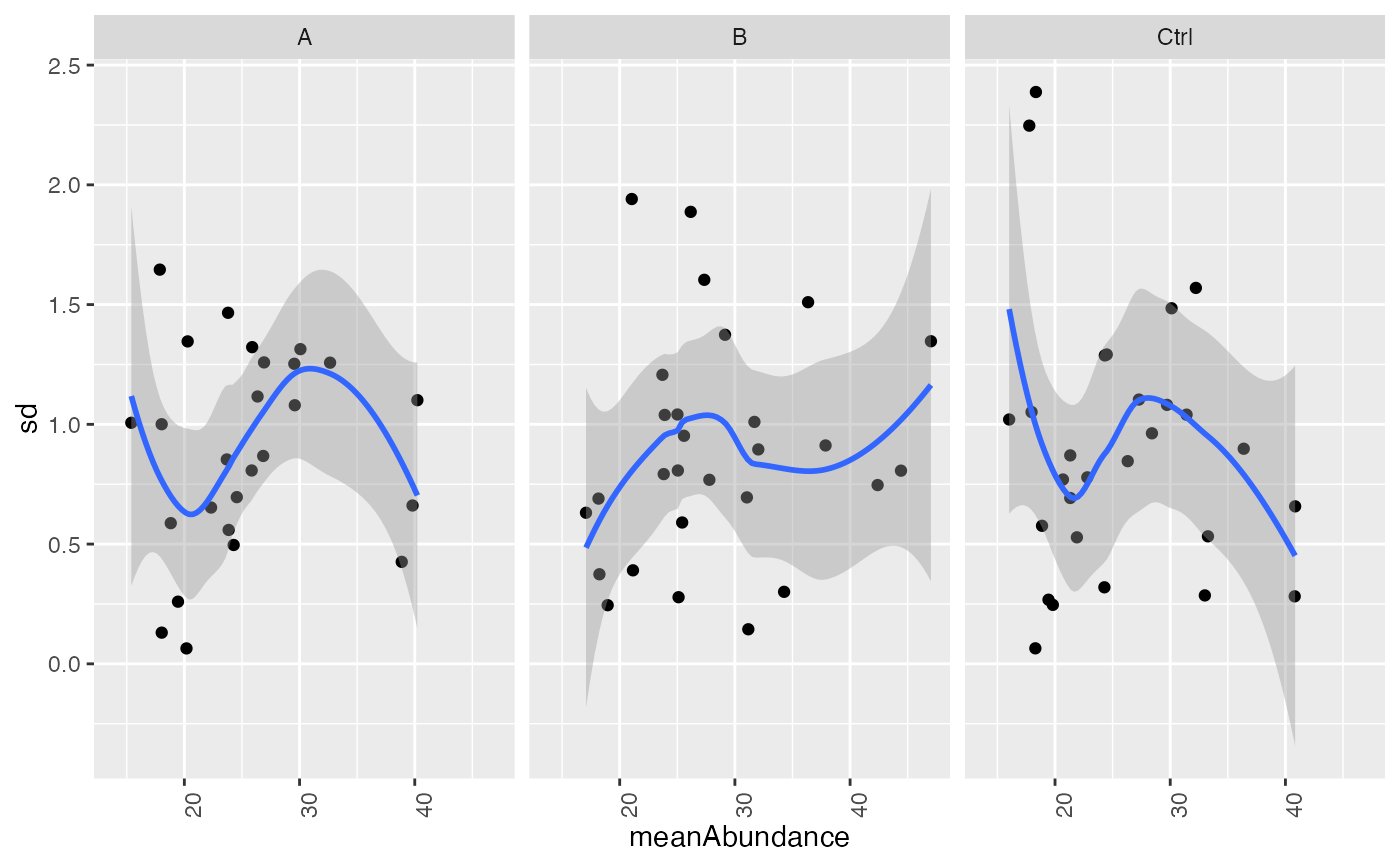
plot stddev vs mean to asses stability of variance
Examples
bb1 <- prolfqua::sim_lfq_data_peptide_config()
#> creating sampleName from file_name column
#> completing cases
#> completing cases done
#> setup done
lfq <- LFQData$new(bb1$data, bb1$config)
res <- lfq$get_Stats()$stats()
plot_stdv_vs_mean(res, lfq$relevant_factor_keys())
#> `geom_smooth()` using formula = 'y ~ x'
#> Warning: Removed 2 rows containing non-finite outside the scale range (`stat_smooth()`).
#> Warning: Removed 2 rows containing missing values or values outside the scale range
#> (`geom_point()`).