R6 class representing modelling result
R6 class representing modelling result
See also
Other modelling:
AnovaExtractor,
Contrasts,
ContrastsDEqMSFacade,
ContrastsDEqMSVoomFacade,
ContrastsFacadeBase,
ContrastsFirth,
ContrastsFirthFacade,
ContrastsFirthNestedFacade,
ContrastsLMFacade,
ContrastsLMImputeFacade,
ContrastsLMMissingFacade,
ContrastsLimma,
ContrastsLimmaFacade,
ContrastsLimmaImputeFacade,
ContrastsLimmaVoomFacade,
ContrastsLimmaVoomImputeFacade,
ContrastsLimpaFacade,
ContrastsLimpaNestedFacade,
ContrastsLmerNestedFacade,
ContrastsMissing,
ContrastsModerated,
ContrastsModeratedDEqMS,
ContrastsPlotter,
ContrastsRLMFacade,
ContrastsROPECA,
ContrastsROPECANestedFacade,
ContrastsRfitFacade,
ContrastsRfitImputeFacade,
ContrastsTable,
INTERNAL_FUNCTIONS_BY_FAMILY,
LR_test(),
ModelFirth,
ModelLimma,
StrategyLM,
StrategyLimma,
StrategyLimpa,
StrategyLmer,
StrategyLogistf,
StrategyRLM,
StrategyRfit,
build_contrast_analysis(),
build_model(),
build_model_glm_peptide(),
build_model_glm_protein(),
build_model_impute(),
build_model_limma(),
build_model_limma_impute(),
build_model_limma_voom(),
build_model_limma_voom_impute(),
build_model_limpa(),
build_model_logistf(),
compute_borrowed_variance(),
compute_borrowed_variance_limma(),
compute_contrast(),
compute_lmer_contrast(),
contrasts_fisher_exact(),
df.residual.rfit_prolfqua(),
get_anova_df(),
get_complete_model_fit(),
get_p_values_pbeta(),
group_label(),
impute_refit_singular(),
is_singular_lm(),
linfct_all_possible_contrasts(),
linfct_factors_contrasts(),
linfct_from_model(),
linfct_matrix_contrasts(),
list_facades(),
lookup_facade(),
merge_contrasts_results(),
model_analyse(),
model_summary(),
moderated_p_deqms(),
moderated_p_deqms_long(),
moderated_p_limma(),
moderated_p_limma_long(),
new_imputed_model(),
pivot_model_contrasts_to_wide(),
plot_lmer_peptide_predictions(),
register_facade(),
sigma.rfit_prolfqua(),
sim_build_models_lm(),
sim_build_models_lmer(),
sim_build_models_logistf(),
sim_make_model_lm(),
sim_make_model_lmer(),
strategy_limma(),
strategy_limpa(),
strategy_logistf(),
summary_ROPECA_median_p.scaled(),
unregister_facade(),
vcov.rfit_prolfqua()
Super class
prolfqua::ModelInterface -> Model
Public fields
model_dfdata.frame with modelling data and model.
model_namename of model
subject_ide.g. protein_Id
model_strategyfunction to create the models
anova_dffunction to compute anova
p.adjustfunction to adjust p-values
Methods
Method new()
initialize
Usage
Model$new(
  model_df,
  model_strategy,
  model_name,
  subject_id = "protein_Id",
  p.adjust = prolfqua::adjust_p_values
)
Arguments
model_dfdataframe with modelling results
model_strategymodel_strategy see
strategy_lmermodel_namename of model
subject_idsubject column name
p.adjustmethod to adjust p-values
Method anova_histogram()
histogram of ANOVA results
Usage
Model$anova_histogram(what = c("p.value", "FDR"))Examples
istar <- sim_lfq_data_peptide_config(Nprot = 20)
#> creating sampleName from file_name column
#> completing cases
#> completing cases done
#> setup done
lfqdata <- LFQData$new(istar$data, istar$config)
lfqdata <- lfqdata$get_Transformer()$log2()$lfq
#> Column added : log2_abundance
model_name <- "f_condtion_r_peptide"
formula_randomPeptide <-
strategy_lmer(paste0(lfqdata$response(), " ~ group_ + (1 | peptide_Id)"),
model_name = model_name)
mod <- prolfqua::build_model(
lfqdata,
formula_randomPeptide,
model_name = model_name)
#> boundary (singular) fit: see help('isSingular')
#> boundary (singular) fit: see help('isSingular')
#> boundary (singular) fit: see help('isSingular')
#> boundary (singular) fit: see help('isSingular')
#> Warning: There were 7 warnings in `dplyr::mutate()`.
#> The first warning was:
#> ℹ In argument: `linear_model = purrr::map(data, model_strategy$model_fun, pb =
#> pb)`.
#> ℹ In group 1: `protein_Id = "0EfVhX~5954"`.
#> Caused by warning:
#> ! grouping factors must have > 1 sampled level
#> ℹ Run `dplyr::last_dplyr_warnings()` to see the 6 remaining warnings.
mod$model_df
#> # A tibble: 20 × 9
#> # Groups: protein_Id [20]
#> protein_Id data linear_model has_model_fit isSingular df.residual sigma
#> <chr> <list> <list> <lgl> <lgl> <dbl> <dbl>
#> 1 0EfVhX~59… <tibble> <chr [1]> FALSE NA NA NA
#> 2 0m5WN4~14… <tibble> <lmrMdLmT> TRUE FALSE 15 0.120
#> 3 7cbcrd~83… <tibble> <chr [1]> FALSE NA NA NA
#> 4 9VUkAq~45… <tibble> <lmrMdLmT> TRUE FALSE 156 0.203
#> 5 At886V~32… <tibble> <lmrMdLmT> TRUE FALSE 51 0.118
#> 6 BEJI92~91… <tibble> <lmrMdLmT> TRUE TRUE 39 0.460
#> 7 CGzoYe~28… <tibble> <chr [1]> FALSE NA NA NA
#> 8 CtOJ9t~28… <tibble> <lmrMdLmT> TRUE FALSE 54 0.123
#> 9 DoWup2~29… <tibble> <lmrMdLmT> TRUE FALSE 75 0.239
#> 10 DuwH7n~34… <tibble> <lmrMdLmT> TRUE FALSE 28 0.215
#> 11 Fl4JiV~75… <tibble> <chr [1]> FALSE NA NA NA
#> 12 HC8K98~49… <tibble> <lmrMdLmT> TRUE TRUE 15 0.222
#> 13 HvIpHG~40… <tibble> <lmrMdLmT> TRUE TRUE 18 0.158
#> 14 I1Jk2Z~08… <tibble> <lmrMdLmT> TRUE FALSE 79 0.189
#> 15 JV3Z7t~29… <tibble> <chr [1]> FALSE NA NA NA
#> 16 JcKVfU~08… <tibble> <chr [1]> FALSE NA NA NA
#> 17 JfvT8X~27… <tibble> <lmrMdLmT> TRUE FALSE 121 0.210
#> 18 R2i6w7~02… <tibble> <lmrMdLmT> TRUE TRUE 15 0.124
#> 19 SGIVBl~95… <tibble> <lmrMdLmT> TRUE FALSE 19 0.0997
#> 20 r2J0Eh~26… <tibble> <chr [1]> FALSE NA NA NA
#> # ℹ 2 more variables: nr_coef <int>, nr_coef_not_NA <int>
aovtable <- mod$get_anova()
mod$get_coefficients()
#> # A tibble: 39 × 9
#> # Groups: protein_Id [13]
#> protein_Id factor Estimate Std..Error df t.value Pr...t.. isSingular
#> <chr> <chr> <dbl> <dbl> <dbl> <dbl> <dbl> <lgl>
#> 1 0m5WN4~1448 (Intercep… 4.16 0.0440 4.58 94.6 1.01e- 8 FALSE
#> 2 0m5WN4~1448 group_B -0.0614 0.0686 16.2 -0.896 3.83e- 1 FALSE
#> 3 0m5WN4~1448 group_Ctrl 0.0815 0.0622 16.1 1.31 2.09e- 1 FALSE
#> 4 9VUkAq~4562 (Intercep… 4.22 0.0449 27.8 94.0 2.49e-36 FALSE
#> 5 9VUkAq~4562 group_B -0.0902 0.0395 144. -2.29 2.38e- 2 FALSE
#> 6 9VUkAq~4562 group_Ctrl -0.0699 0.0400 145. -1.75 8.26e- 2 FALSE
#> 7 At886V~3296 (Intercep… 4.12 0.0434 7.61 94.9 5.63e-13 FALSE
#> 8 At886V~3296 group_B 0.0771 0.0393 49.1 1.96 5.55e- 2 FALSE
#> 9 At886V~3296 group_Ctrl 0.122 0.0383 49.1 3.19 2.52e- 3 FALSE
#> 10 BEJI92~9143 (Intercep… 4.51 0.123 41.0 36.7 5.60e-33 TRUE
#> # ℹ 29 more rows
#> # ℹ 1 more variable: nr_coef <int>
mod$coef_histogram()
#> $plot
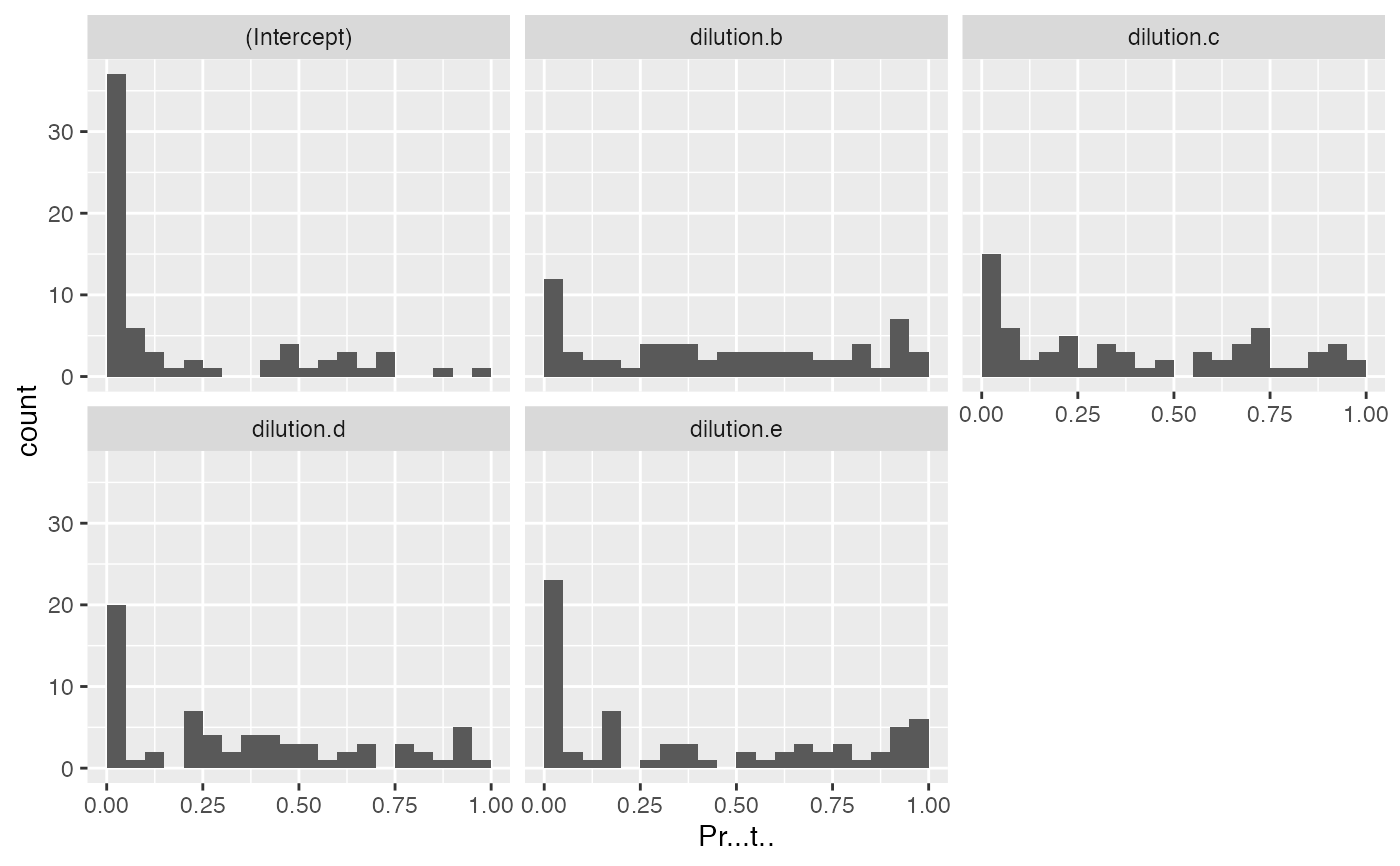 #>
#> $name
#> [1] "Coef_Histogram_f_condtion_r_peptide.pdf"
#>
mod$coef_volcano()
#> $plot
#>
#> $name
#> [1] "Coef_Histogram_f_condtion_r_peptide.pdf"
#>
mod$coef_volcano()
#> $plot
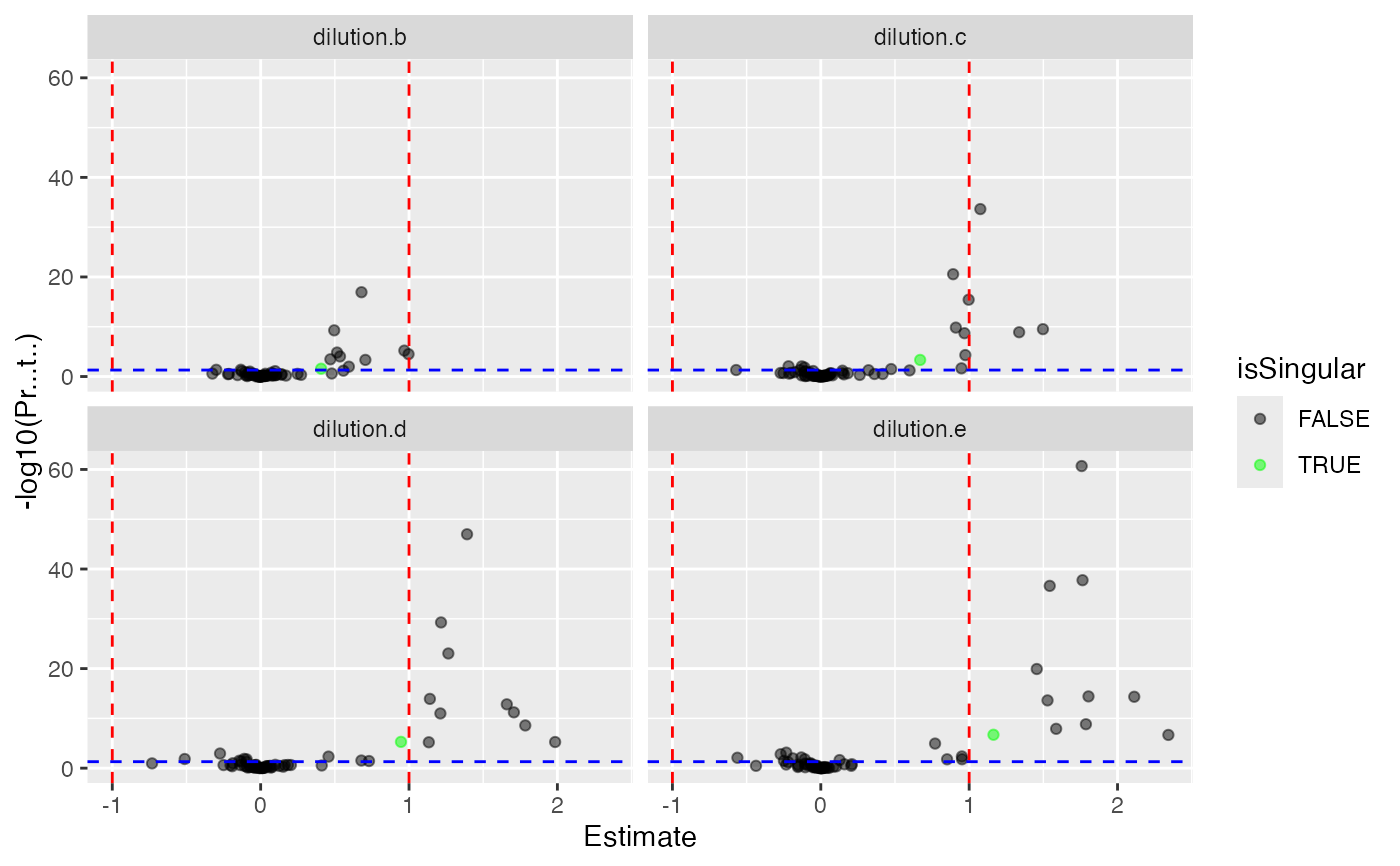 #>
#> $name
#> [1] "Coef_volcano_plot_f_condtion_r_peptide.pdf"
#>
mod$coef_pairs()
#> $plot
#> # A tibble: 13 × 4
#> subject_id `(Intercept)` group_B group_Ctrl
#> <chr> <dbl> <dbl> <dbl>
#> 1 0m5WN4~1448 4.16 -0.0614 0.0815
#> 2 9VUkAq~4562 4.22 -0.0902 -0.0699
#> 3 At886V~3296 4.12 0.0771 0.122
#> 4 BEJI92~9143 4.51 0.204 0.115
#> 5 CtOJ9t~2837 4.84 -0.0838 -0.387
#> 6 DoWup2~2934 4.43 0.316 -0.0374
#> 7 DuwH7n~3402 4.11 -0.00356 0.0990
#> 8 HC8K98~4958 3.89 0.322 0.0752
#> 9 HvIpHG~4015 4.11 0.661 -0.161
#> 10 I1Jk2Z~0821 3.84 0.219 0.276
#> 11 JfvT8X~2727 4.48 -0.0844 -0.194
#> 12 R2i6w7~0288 4.65 -0.410 -0.396
#> 13 SGIVBl~9558 5.12 -0.158 -0.344
#>
#> $name
#> [1] "Coef_Pairsplot_f_condtion_r_peptide.pdf"
#>
mod$anova_histogram()
#> $plot
#>
#> $name
#> [1] "Coef_volcano_plot_f_condtion_r_peptide.pdf"
#>
mod$coef_pairs()
#> $plot
#> # A tibble: 13 × 4
#> subject_id `(Intercept)` group_B group_Ctrl
#> <chr> <dbl> <dbl> <dbl>
#> 1 0m5WN4~1448 4.16 -0.0614 0.0815
#> 2 9VUkAq~4562 4.22 -0.0902 -0.0699
#> 3 At886V~3296 4.12 0.0771 0.122
#> 4 BEJI92~9143 4.51 0.204 0.115
#> 5 CtOJ9t~2837 4.84 -0.0838 -0.387
#> 6 DoWup2~2934 4.43 0.316 -0.0374
#> 7 DuwH7n~3402 4.11 -0.00356 0.0990
#> 8 HC8K98~4958 3.89 0.322 0.0752
#> 9 HvIpHG~4015 4.11 0.661 -0.161
#> 10 I1Jk2Z~0821 3.84 0.219 0.276
#> 11 JfvT8X~2727 4.48 -0.0844 -0.194
#> 12 R2i6w7~0288 4.65 -0.410 -0.396
#> 13 SGIVBl~9558 5.12 -0.158 -0.344
#>
#> $name
#> [1] "Coef_Pairsplot_f_condtion_r_peptide.pdf"
#>
mod$anova_histogram()
#> $plot
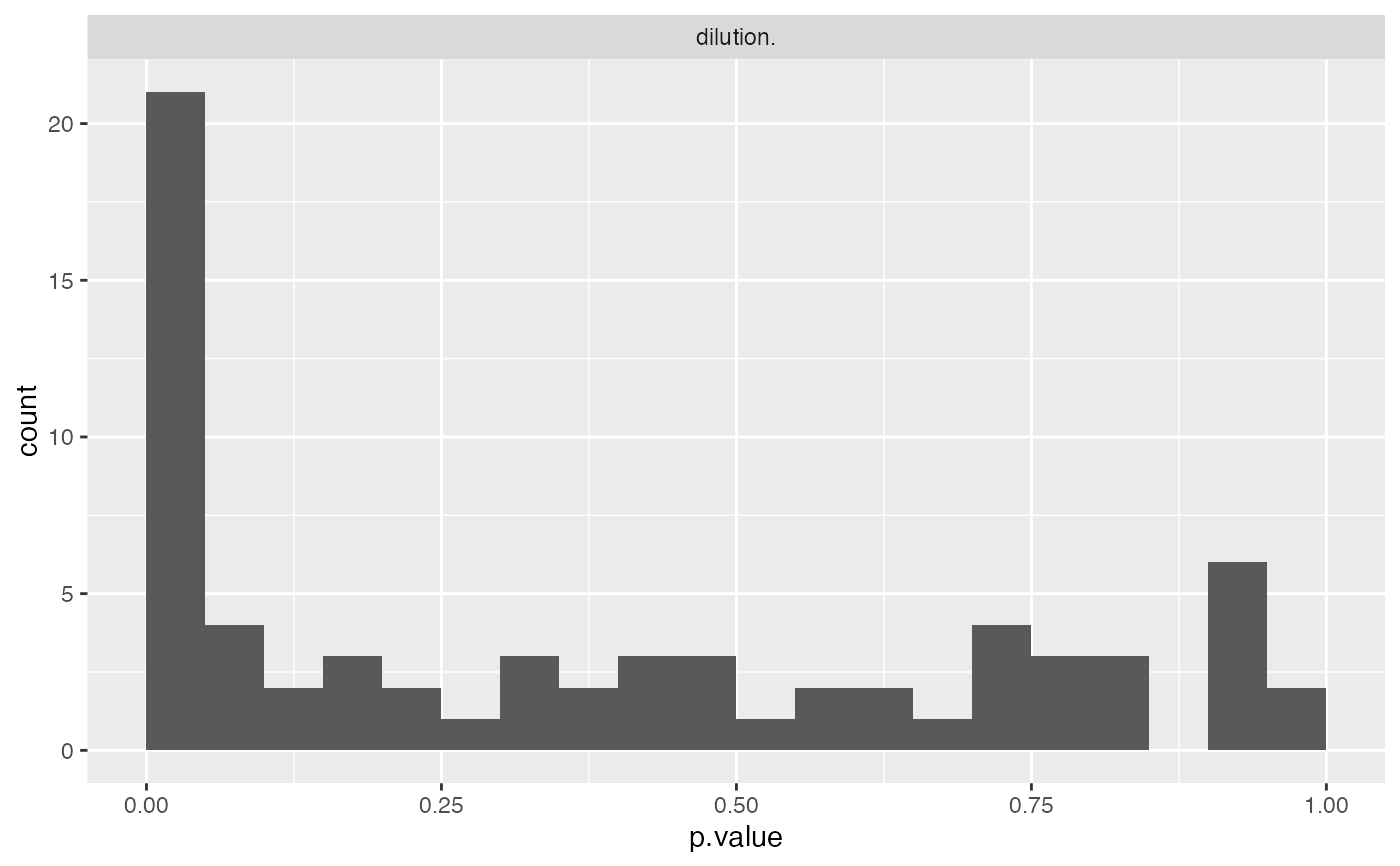 #>
#> $name
#> [1] "Anova_p.values_f_condtion_r_peptide.pdf"
#>
#>
#> $name
#> [1] "Anova_p.values_f_condtion_r_peptide.pdf"
#>